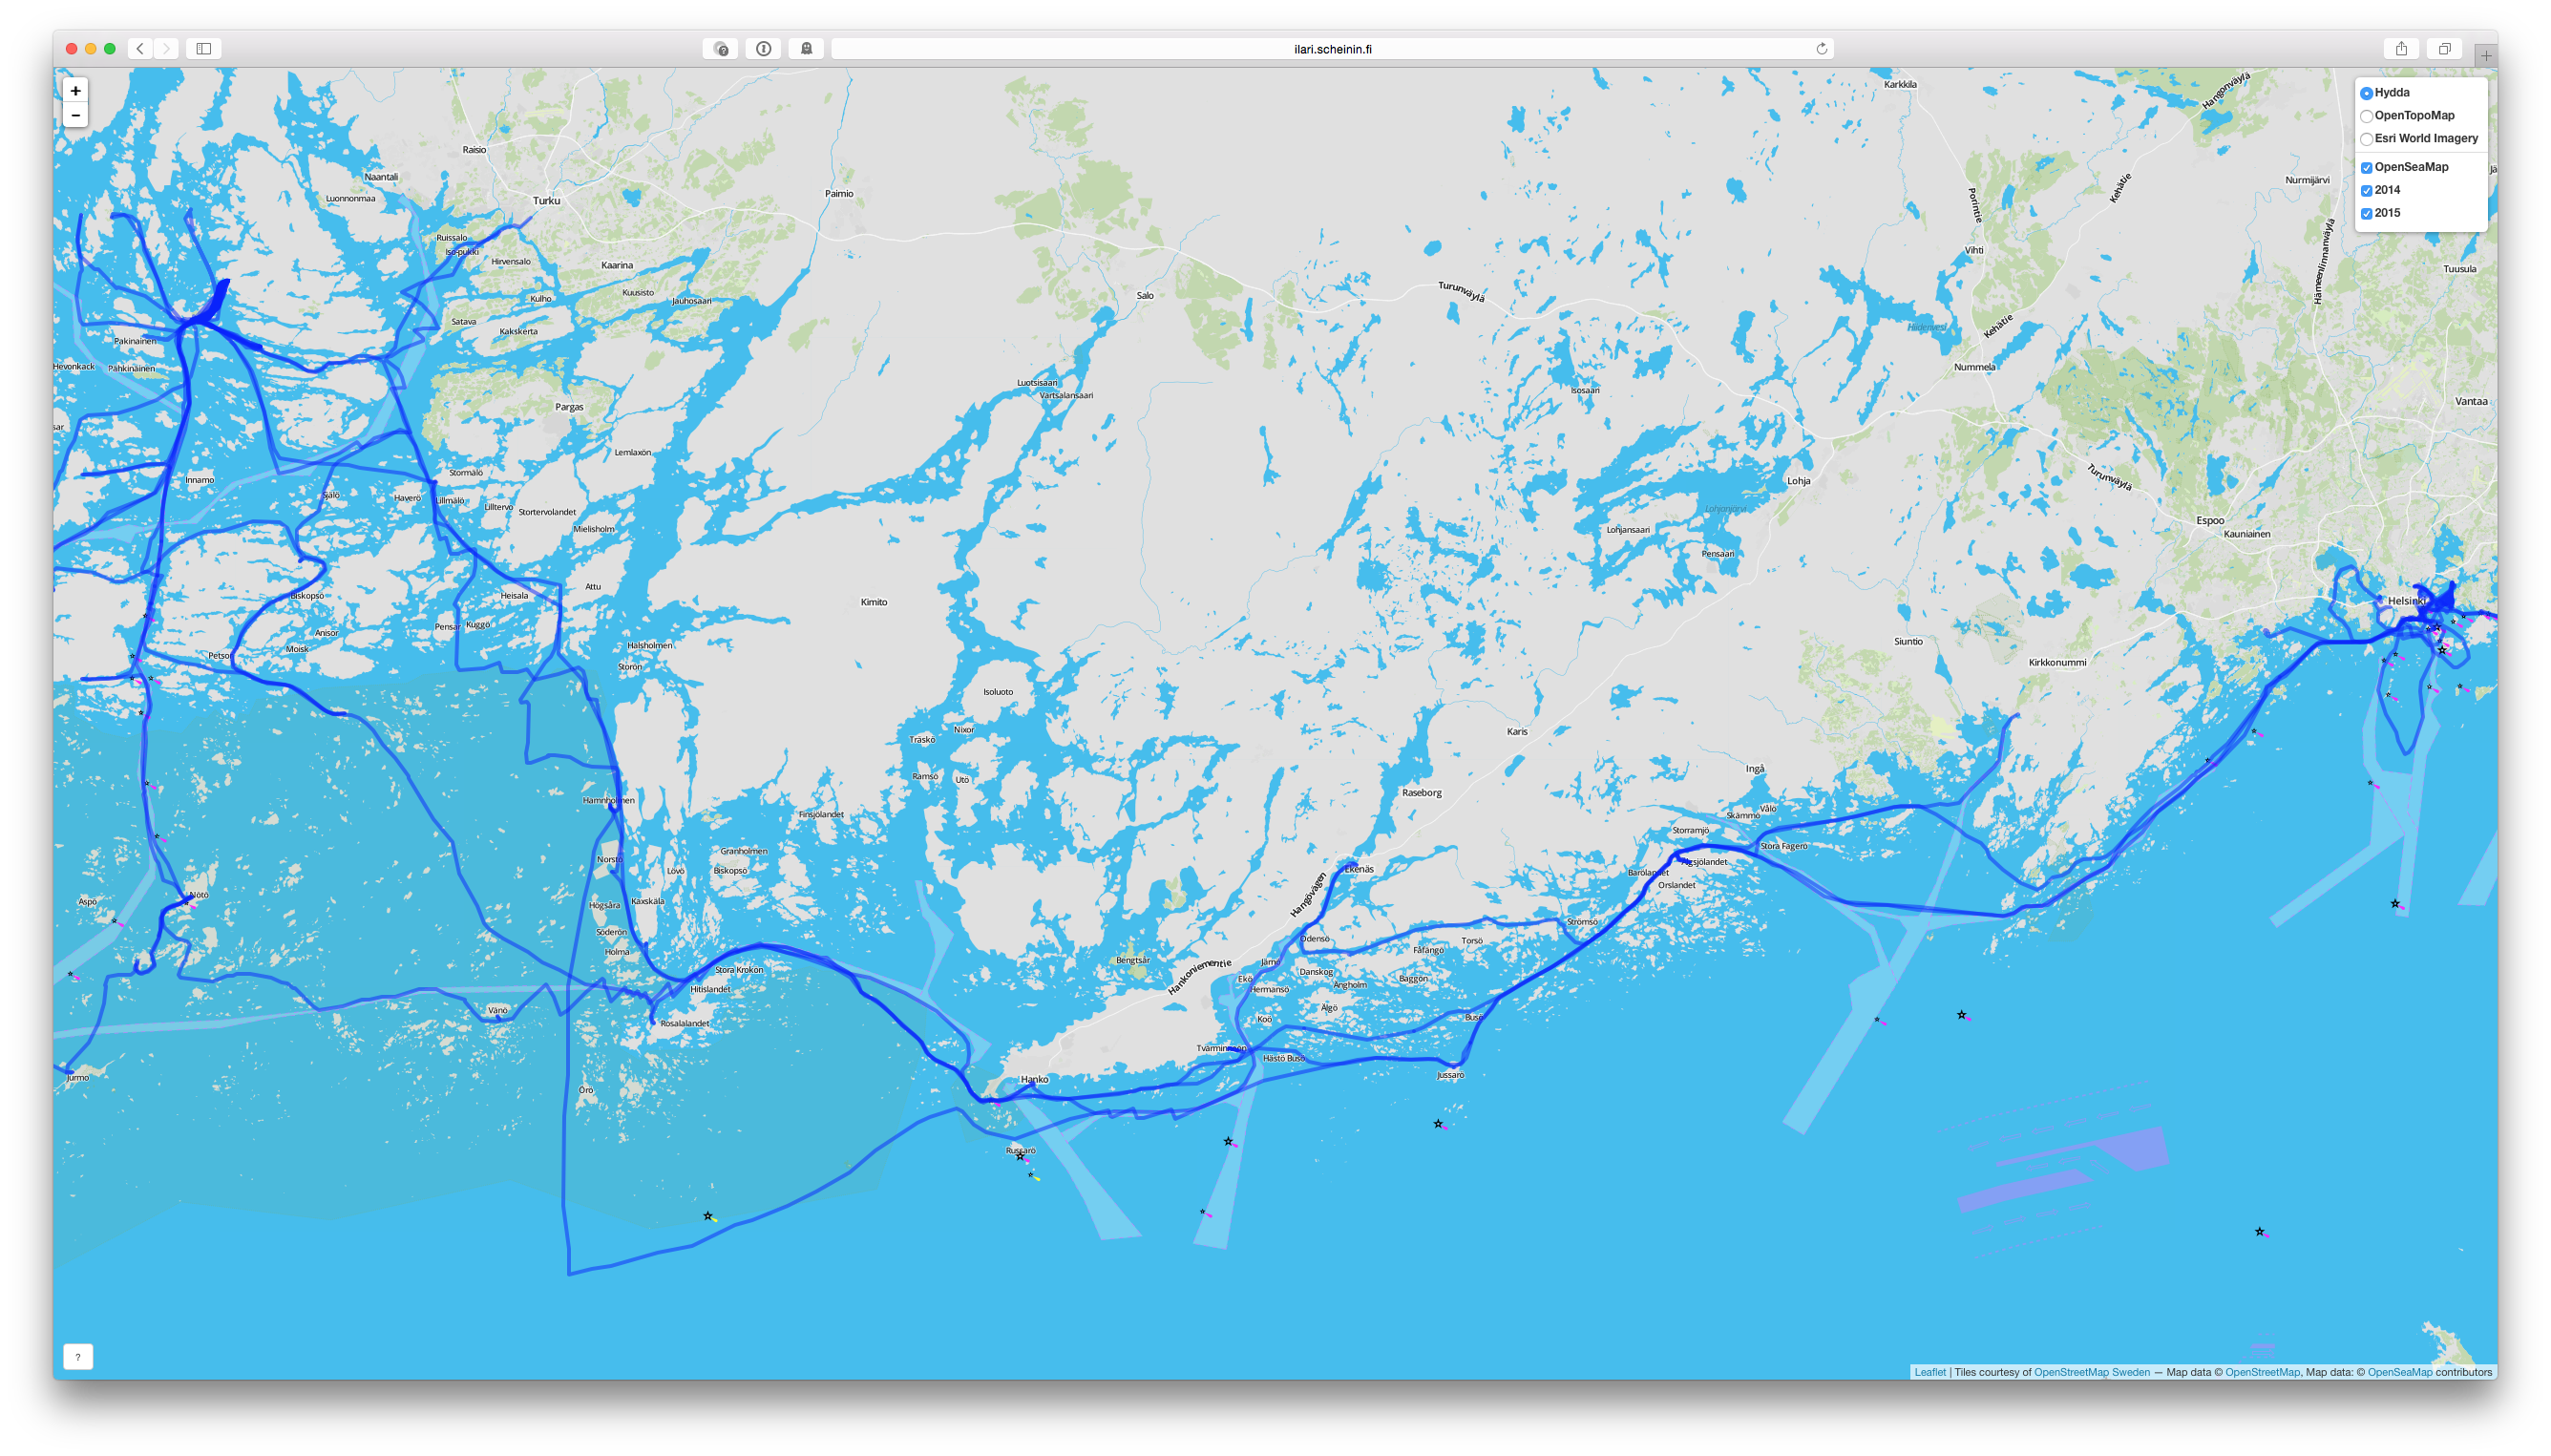
Now, in the middle of winter and when I’m a feeling bit under the weather, it’s a perfect moment to reminisce about summer and time spent on the Finnish Archipelago Sea. So, I combined tracking data from the Moves app with some shiny and leaflet code to make an interactive map that shows my boat trips from the last two years.
The source code can be found on GitHub, and the app itself is here.
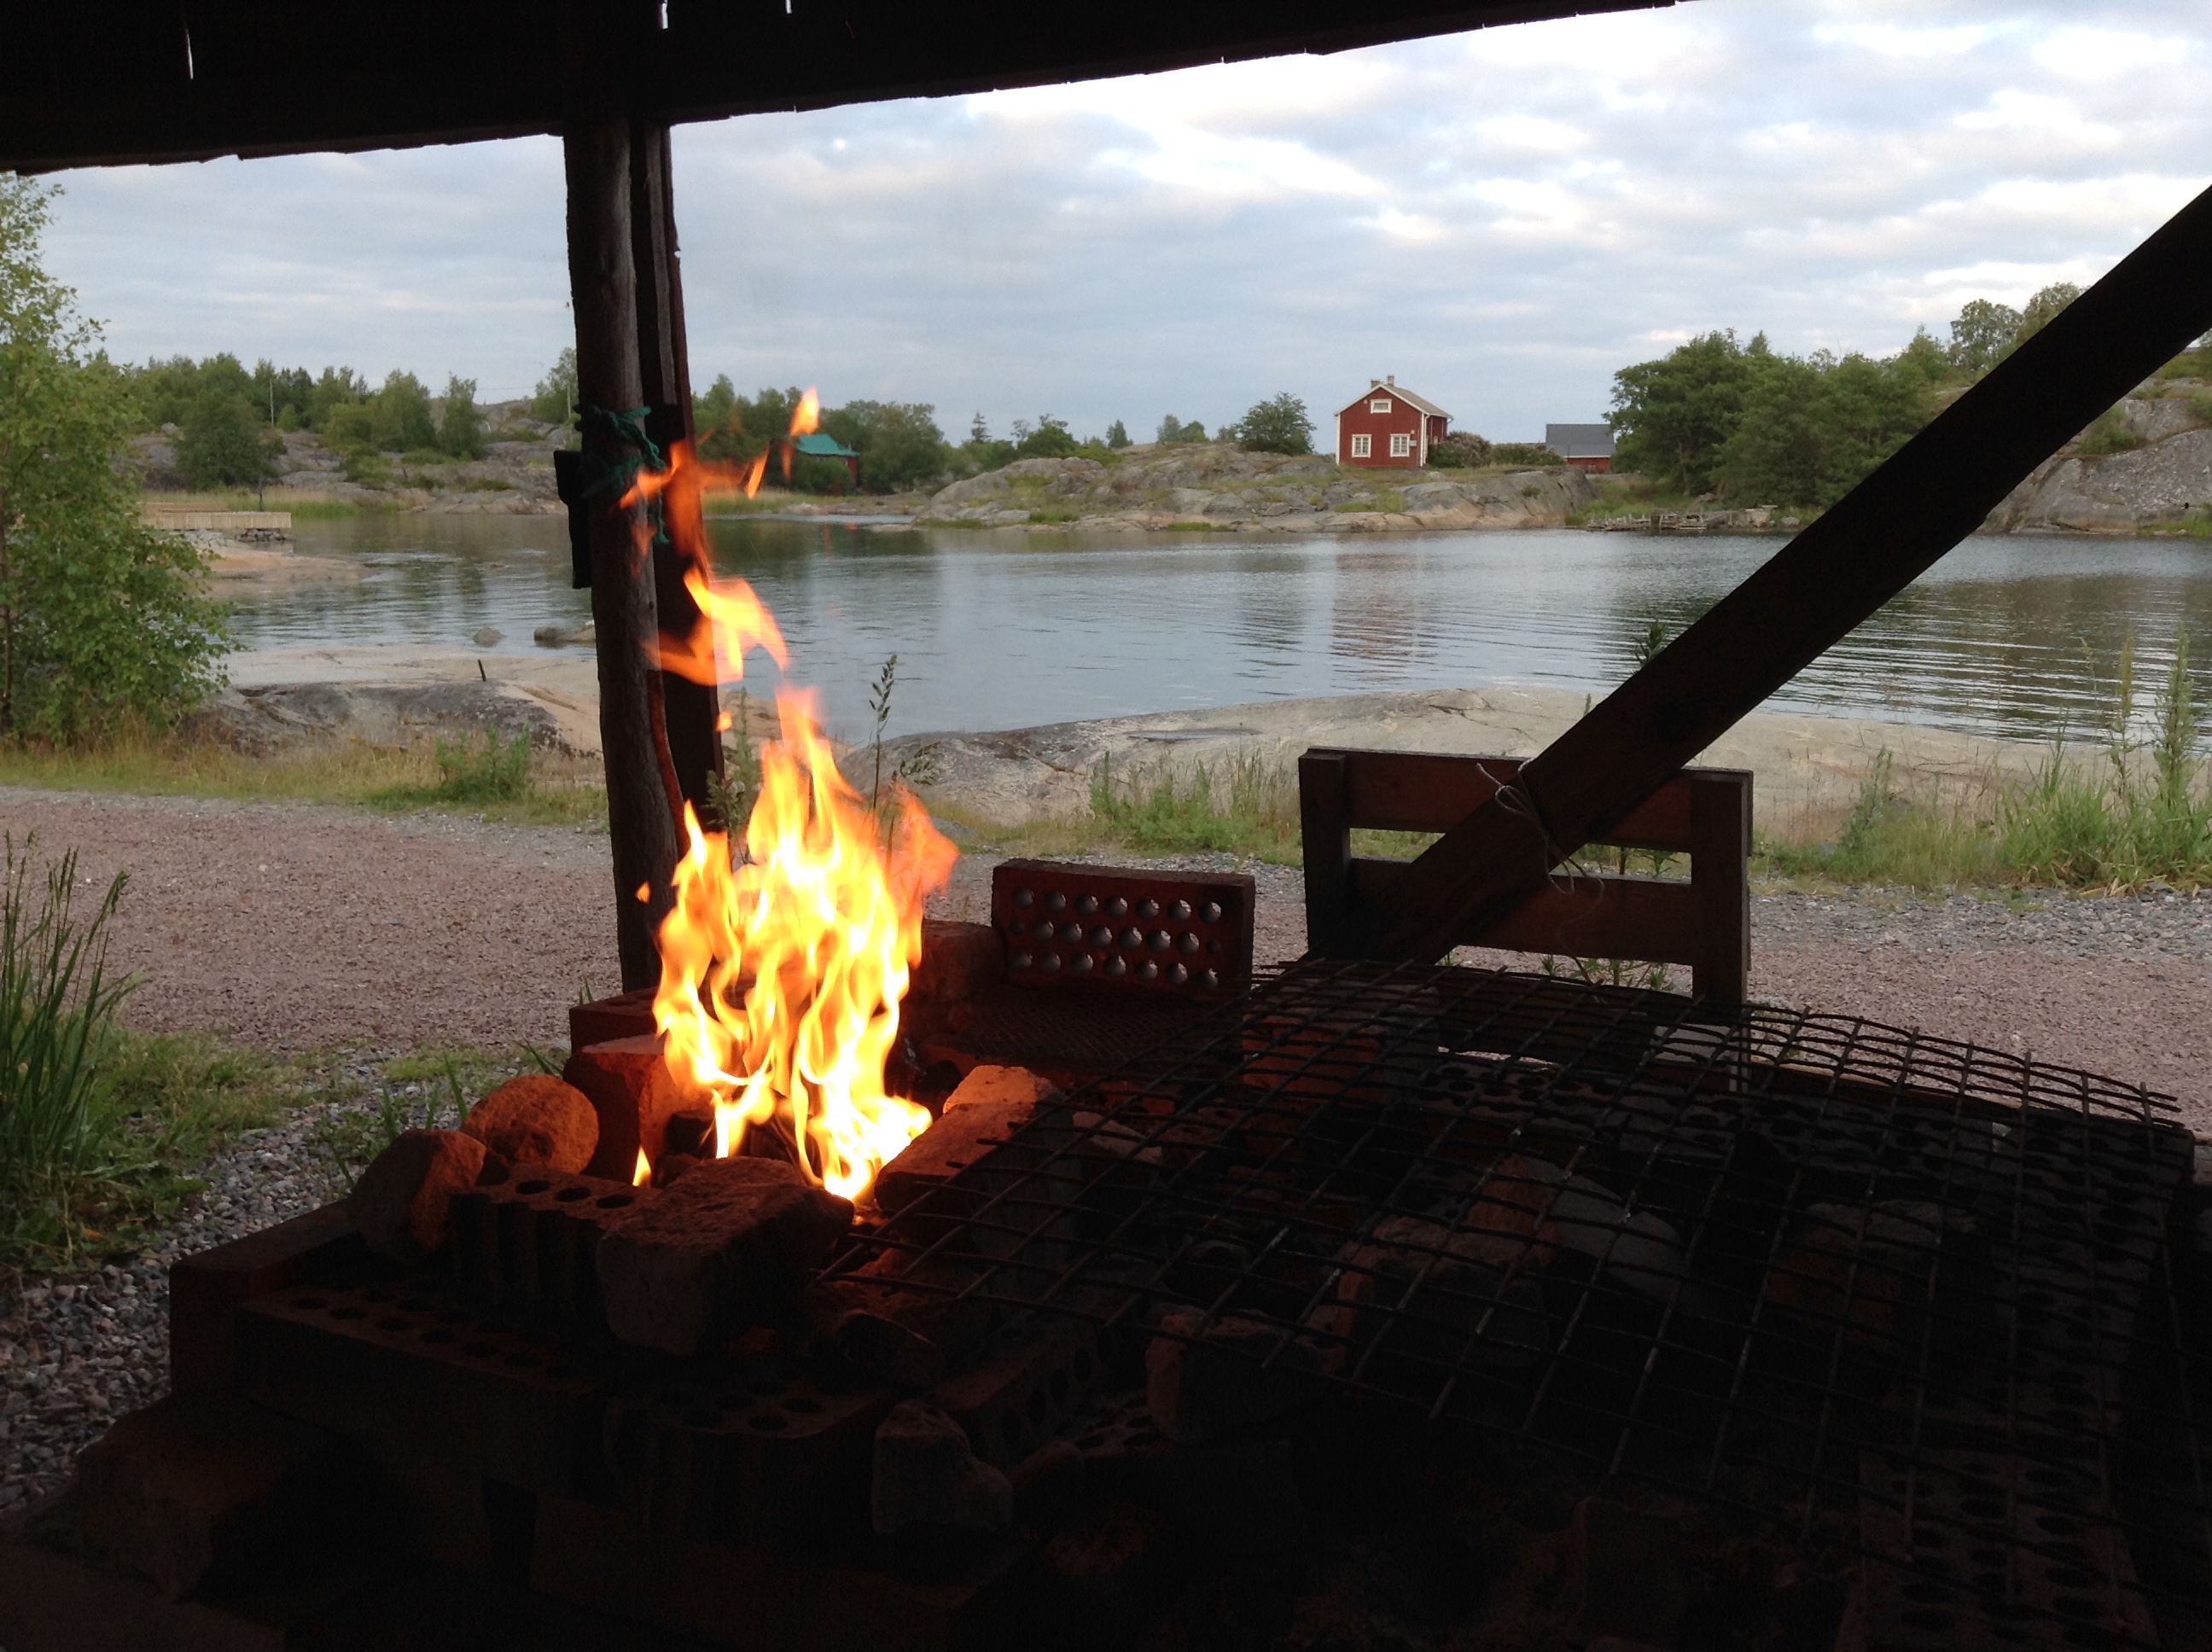
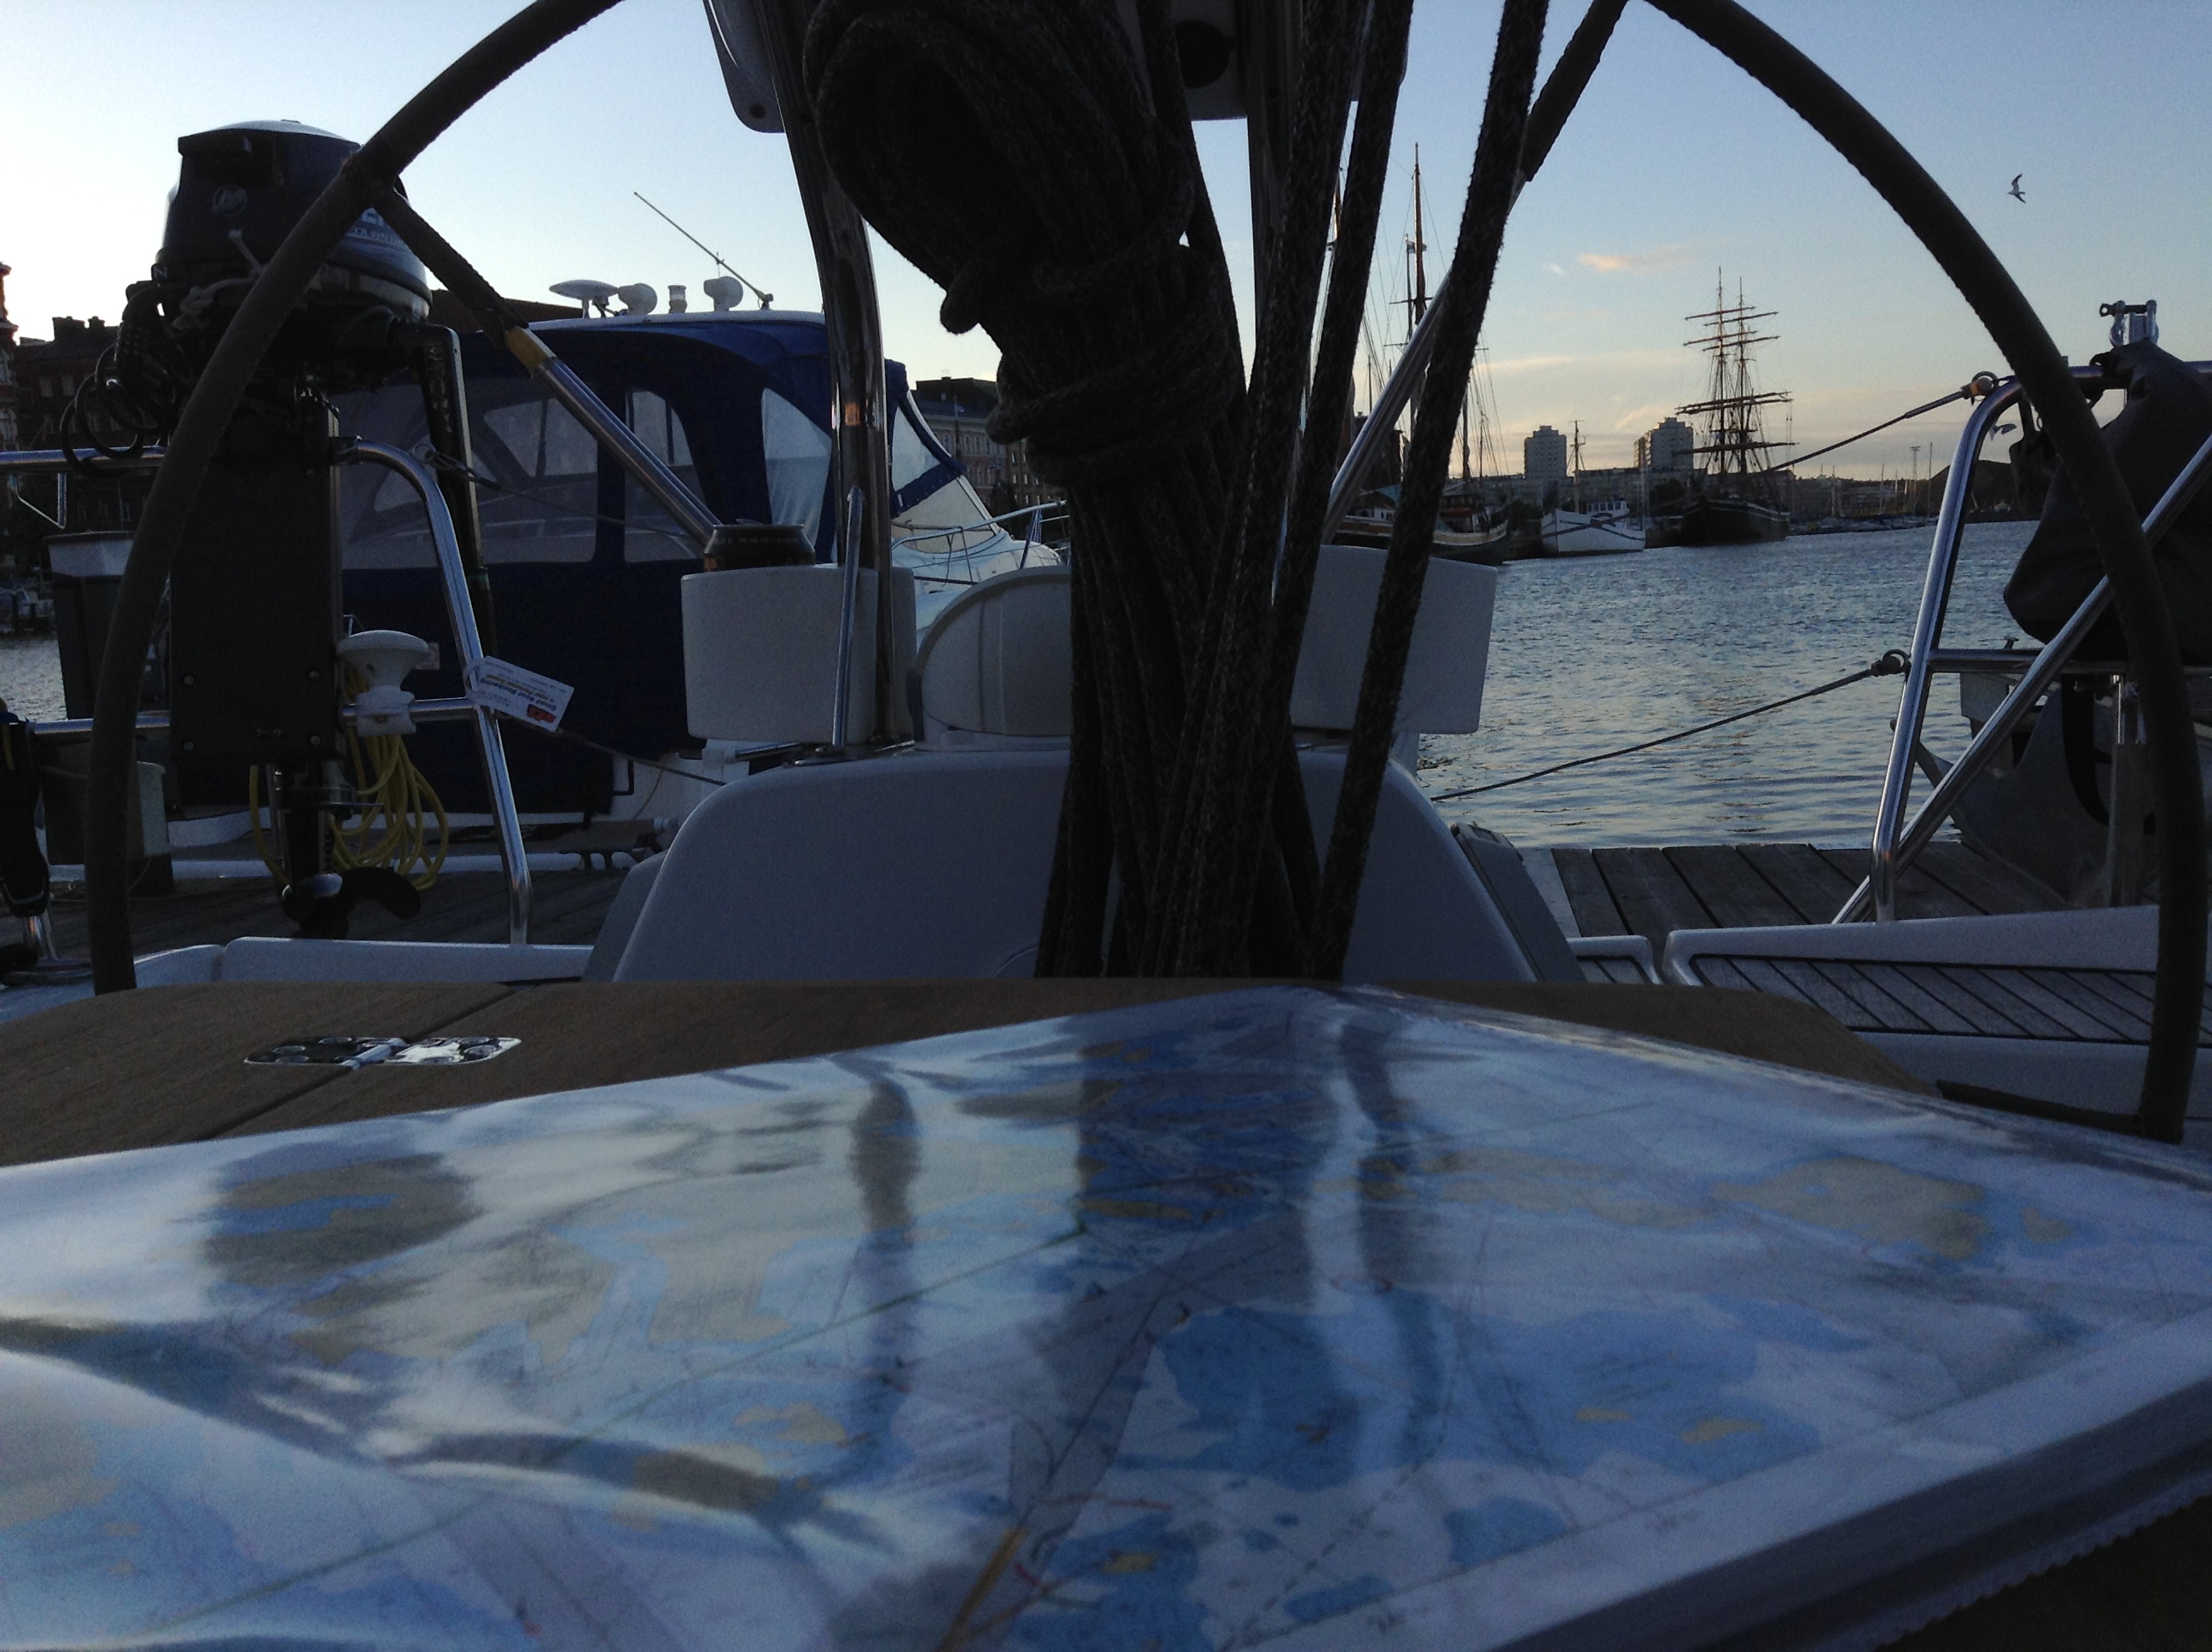
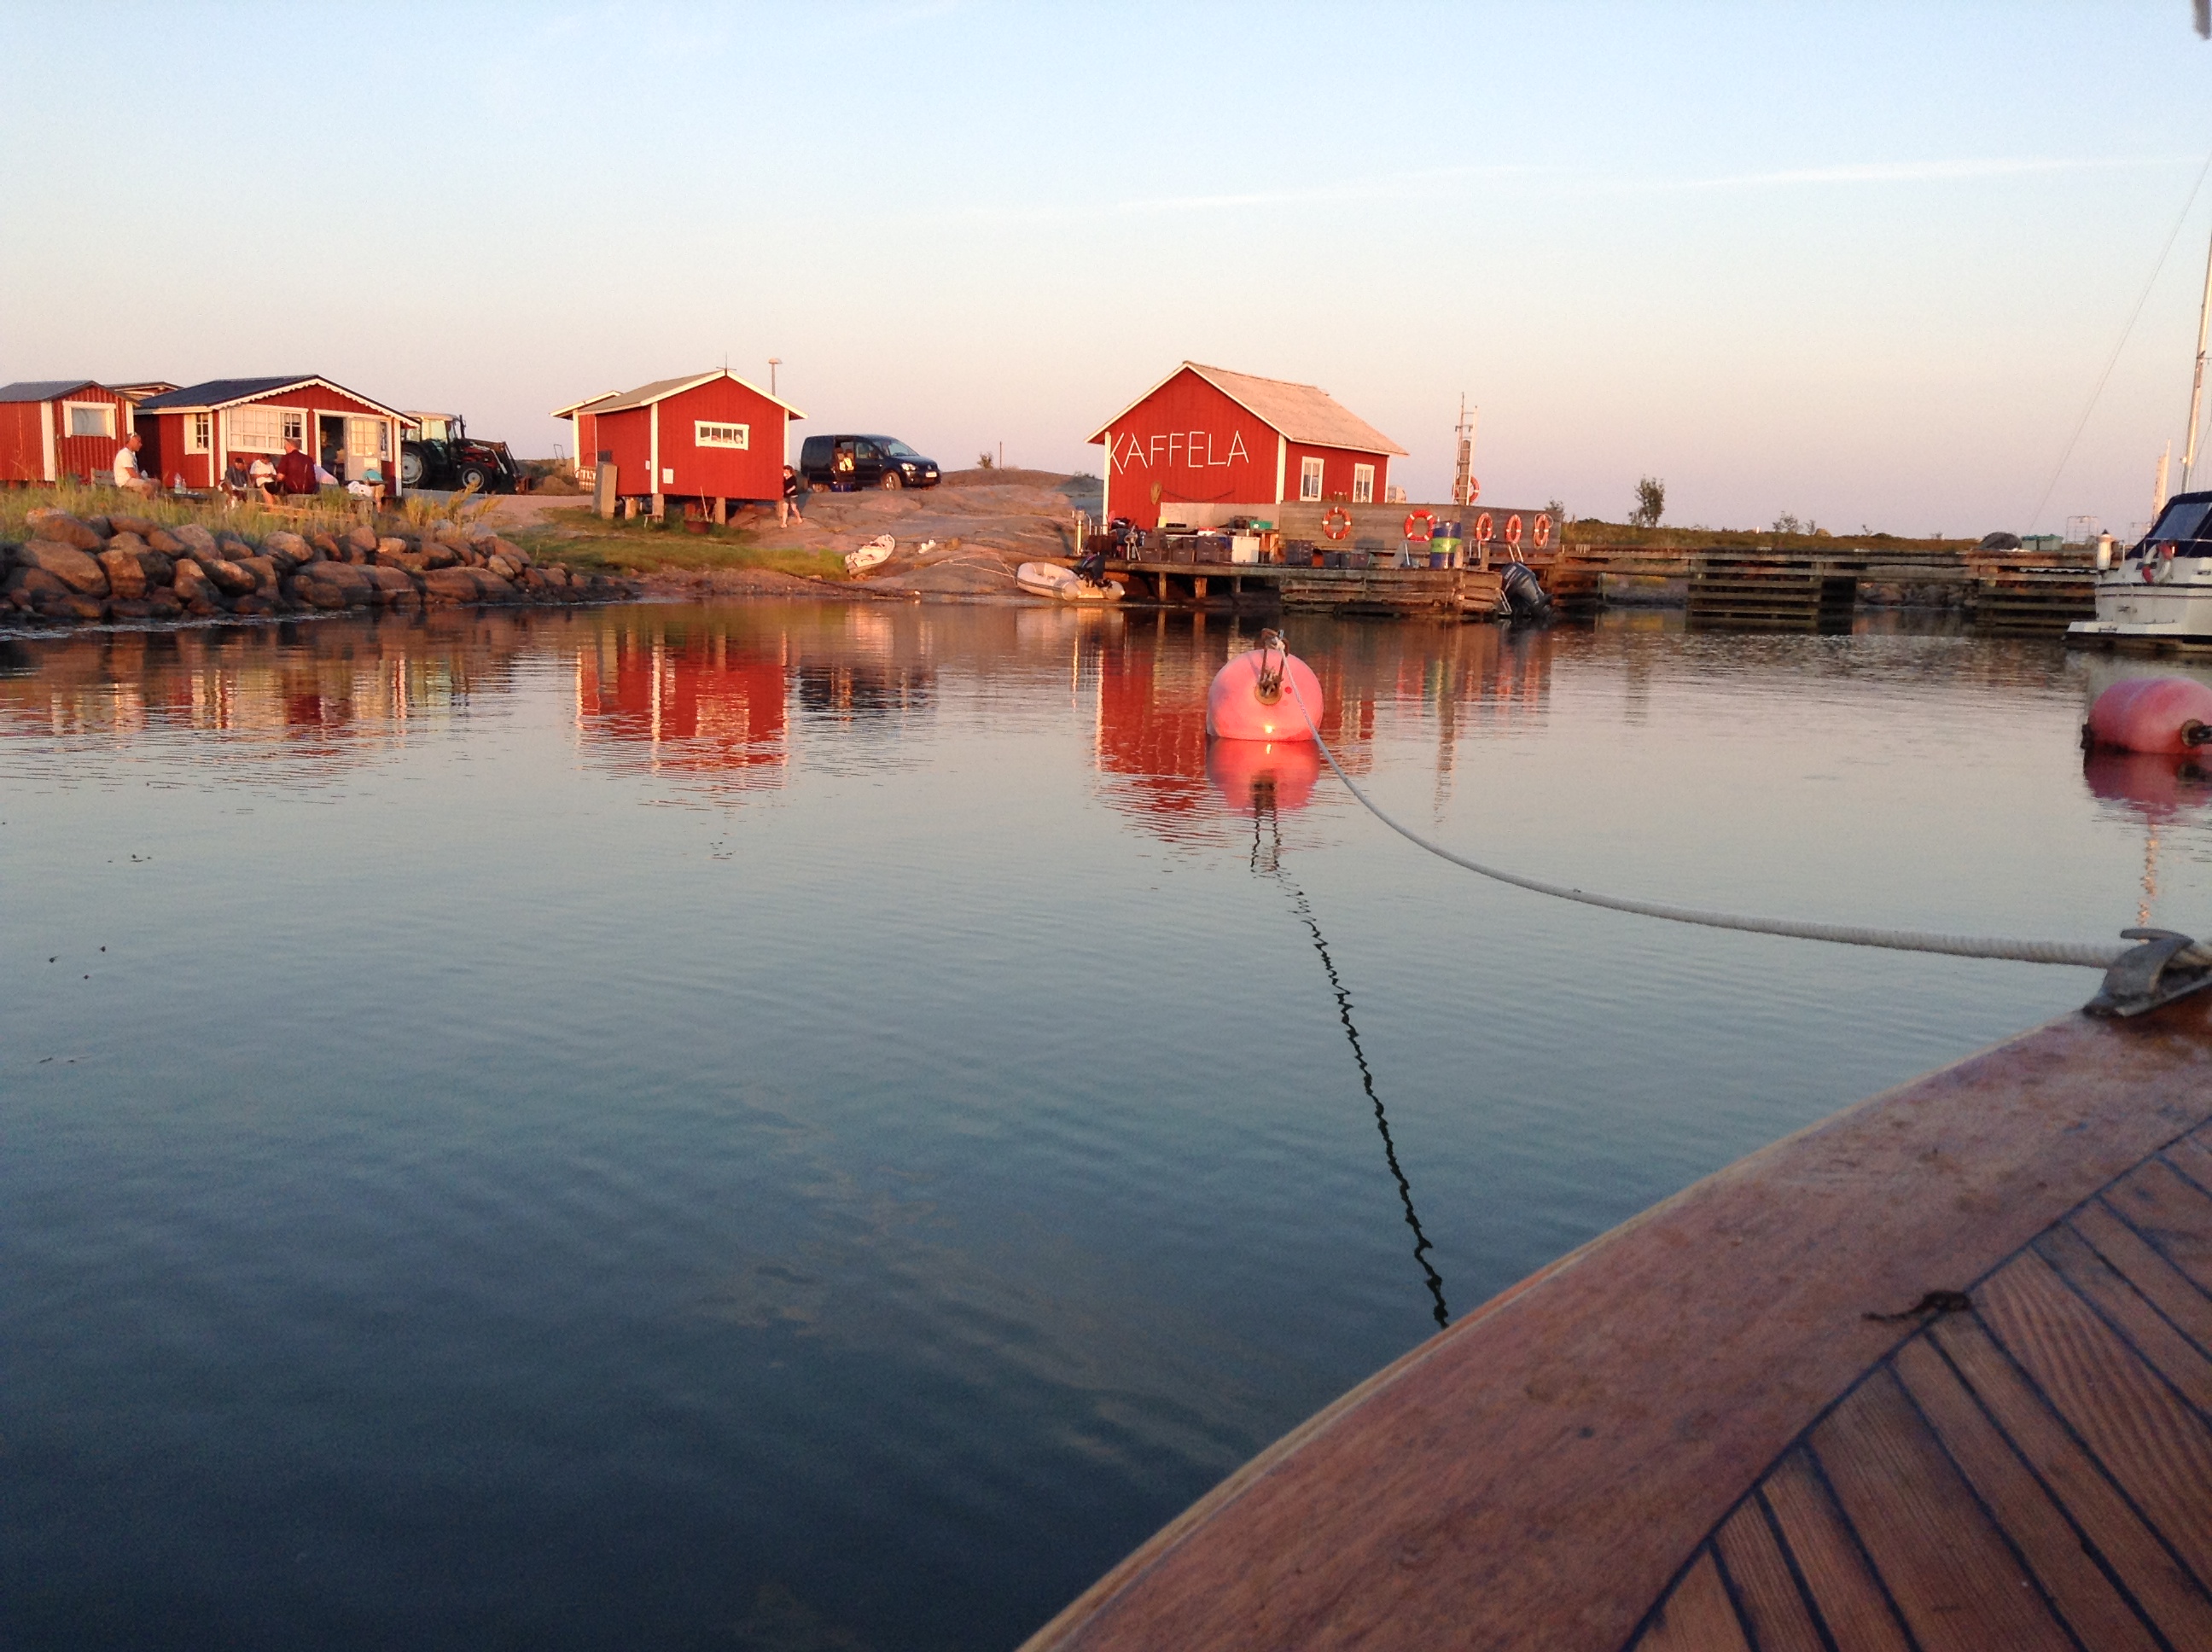
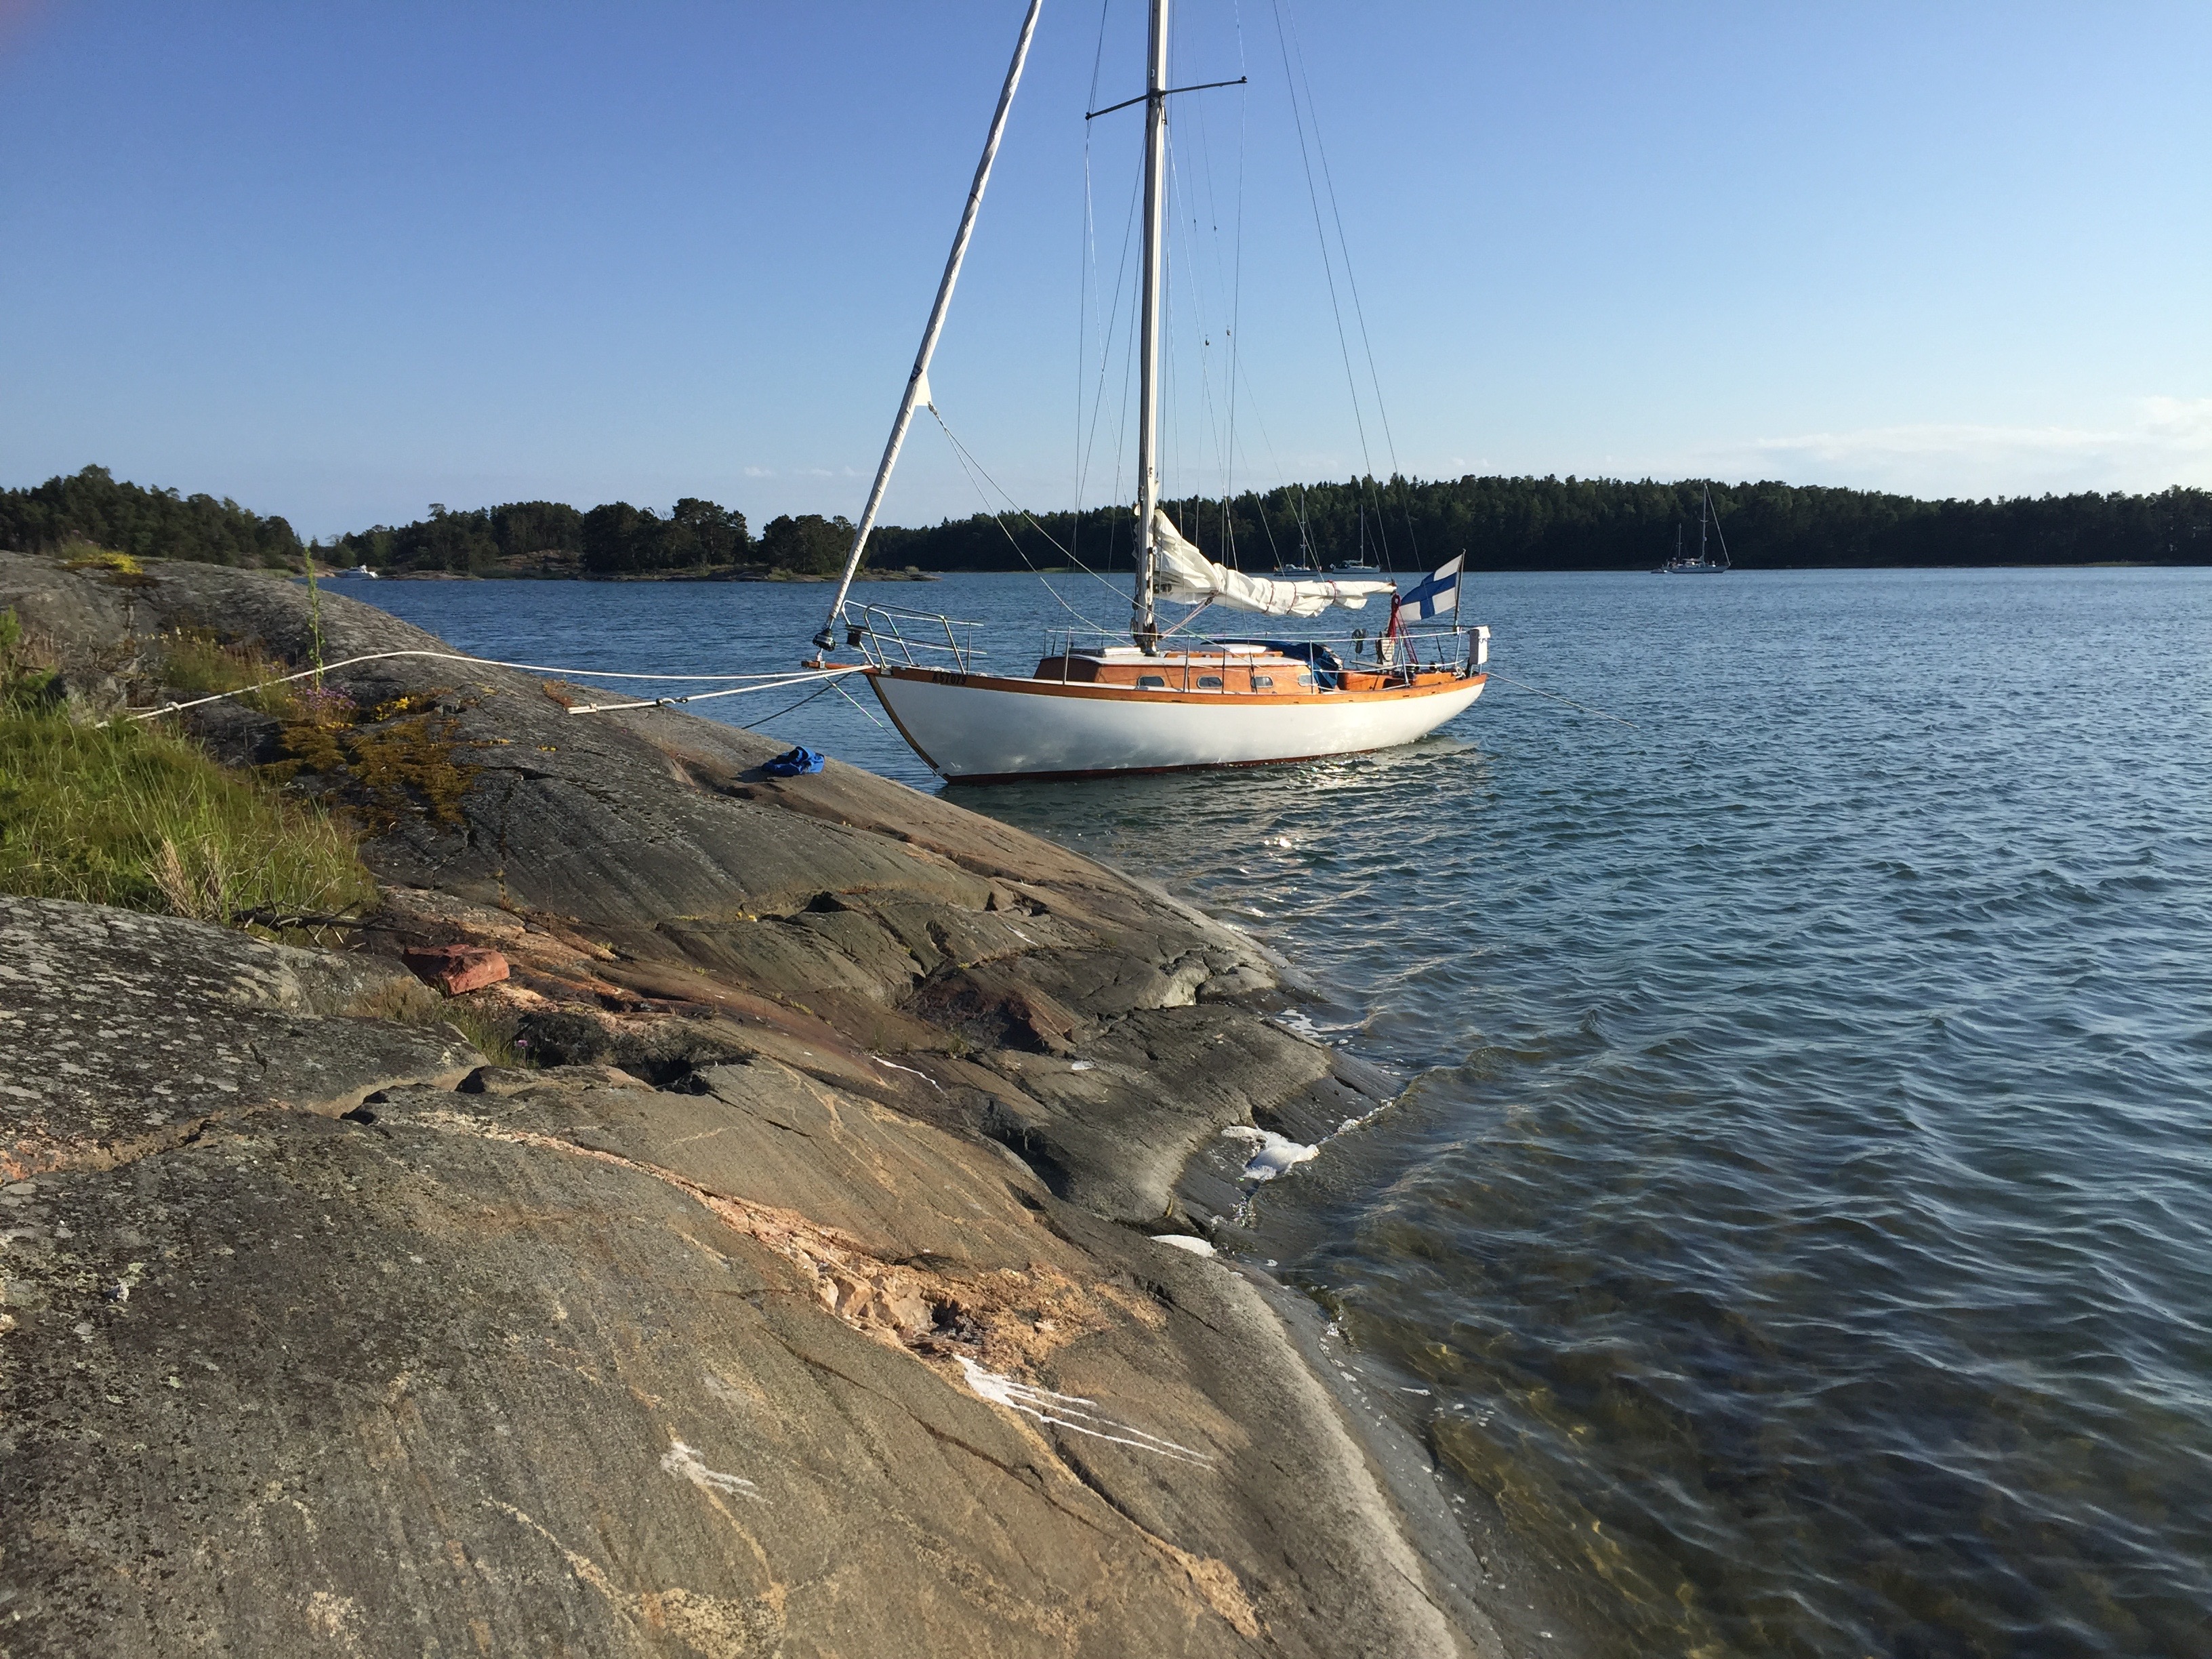
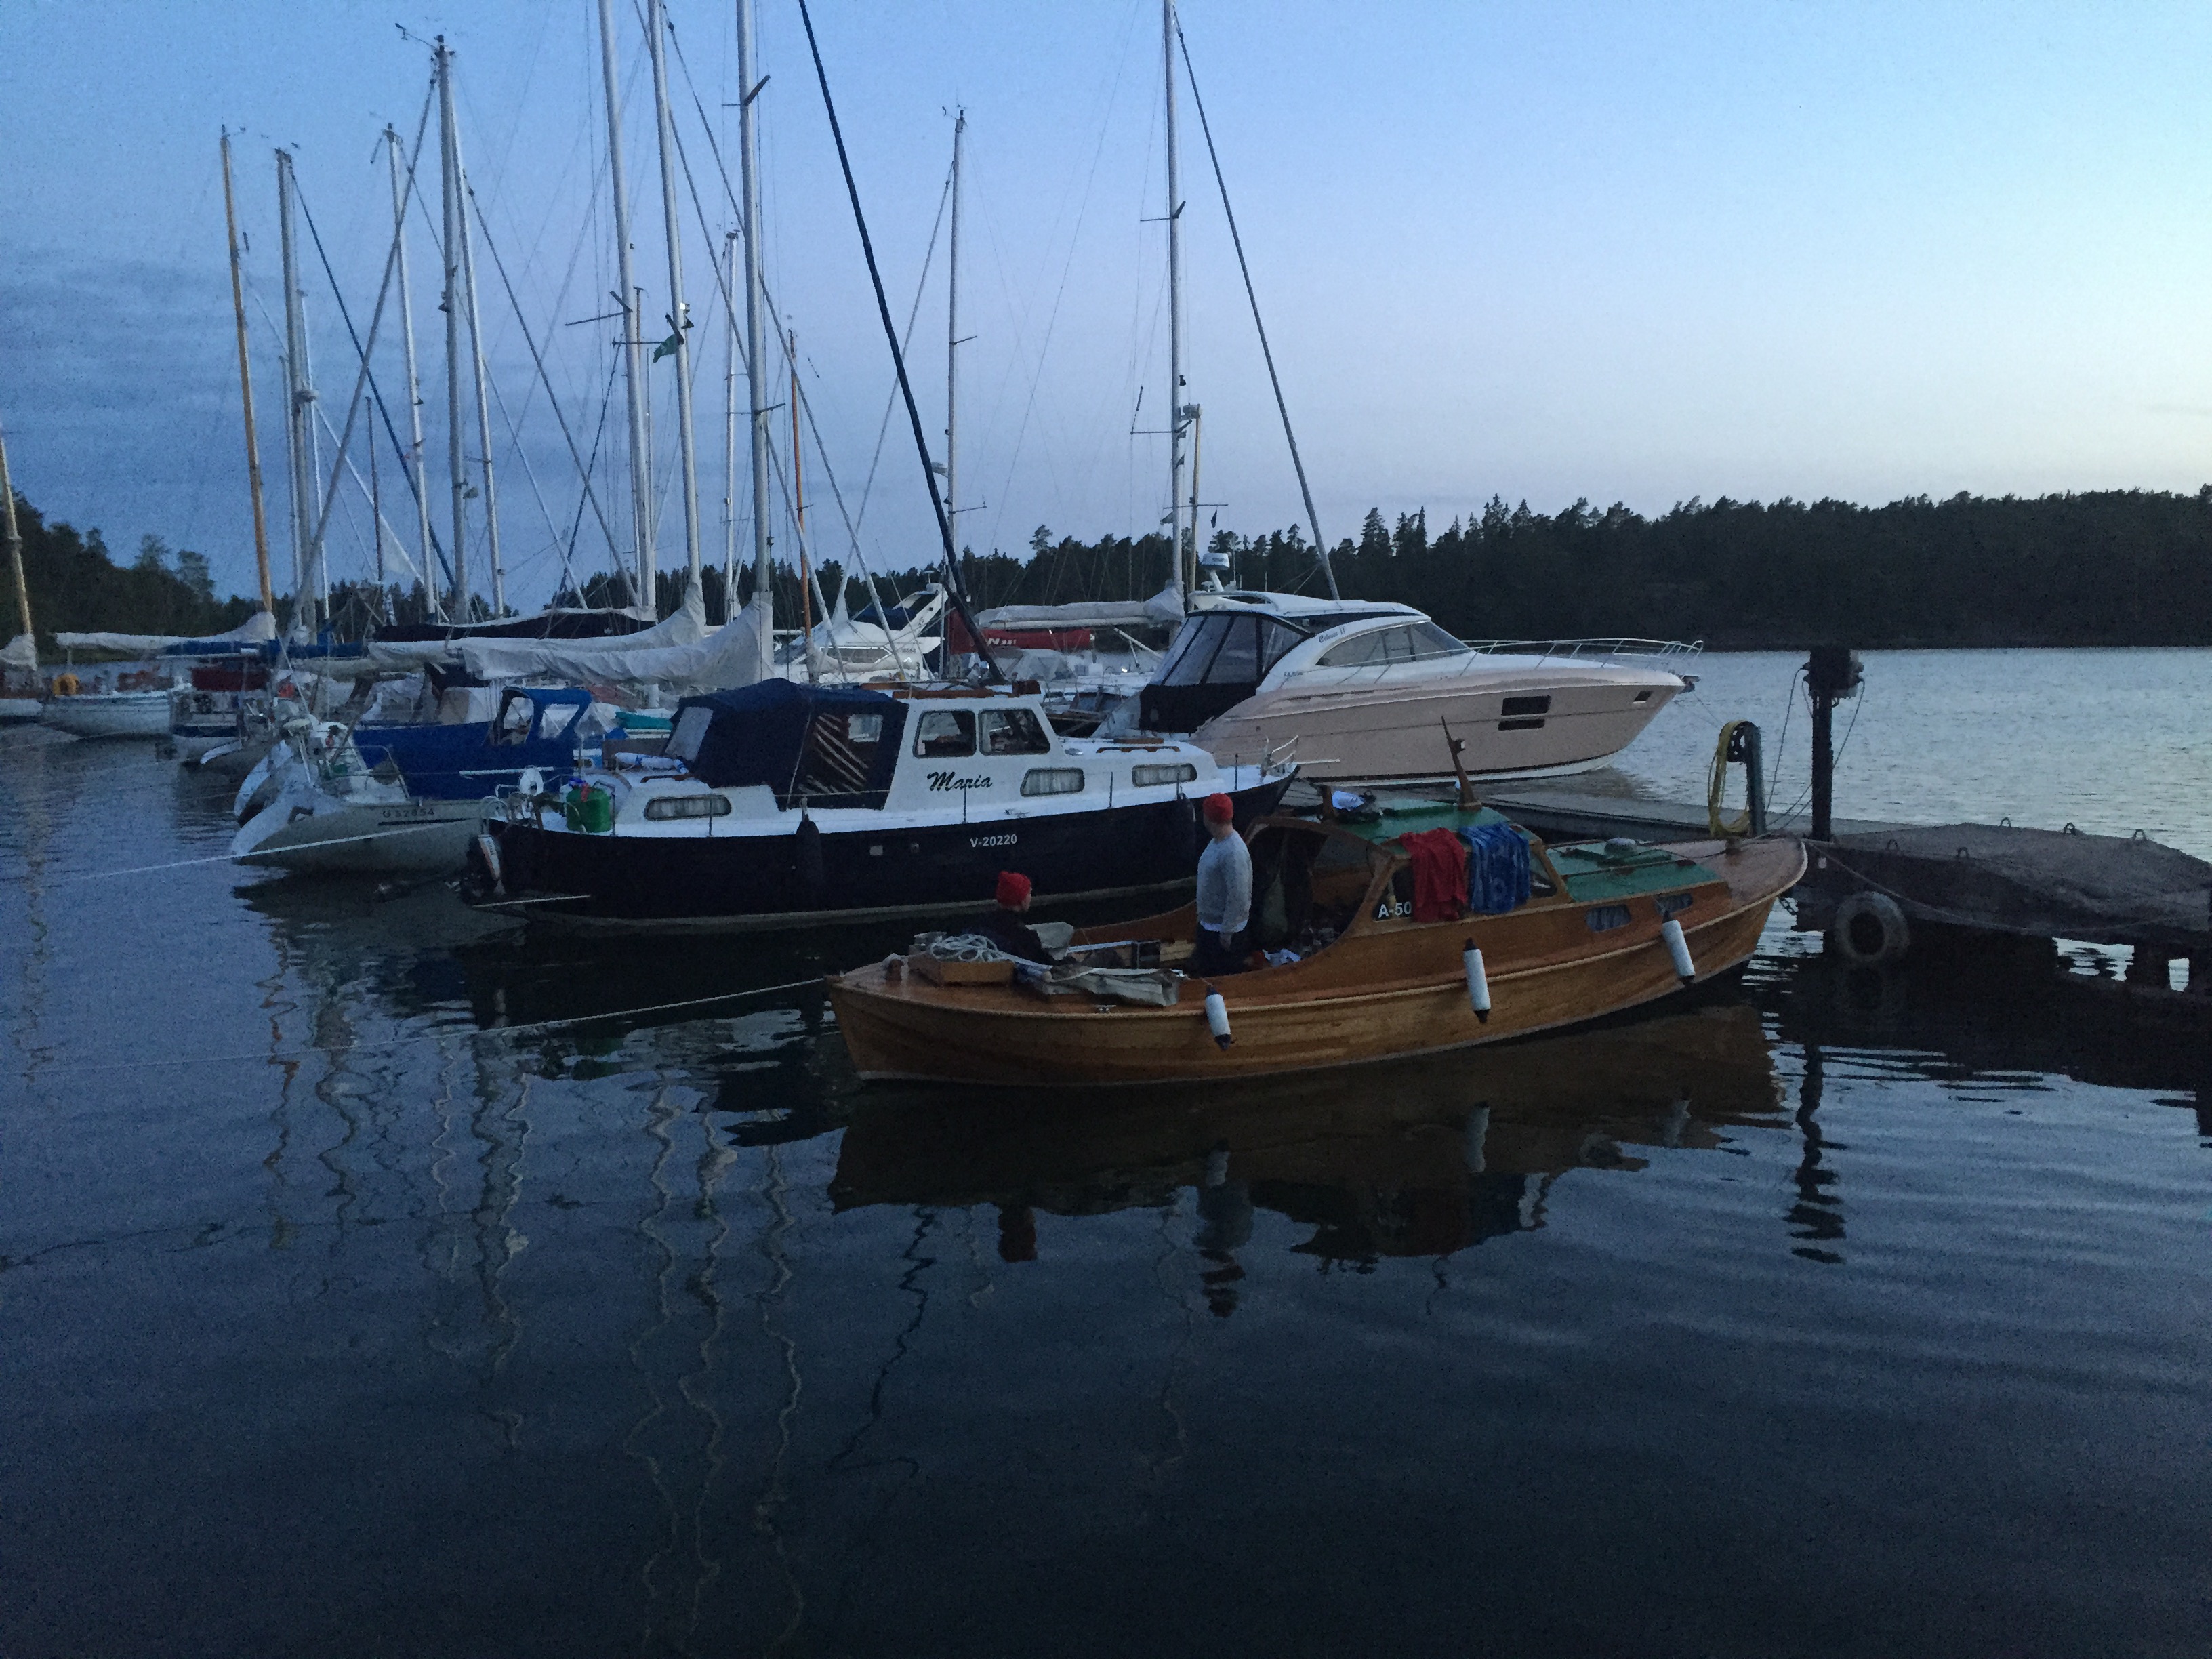
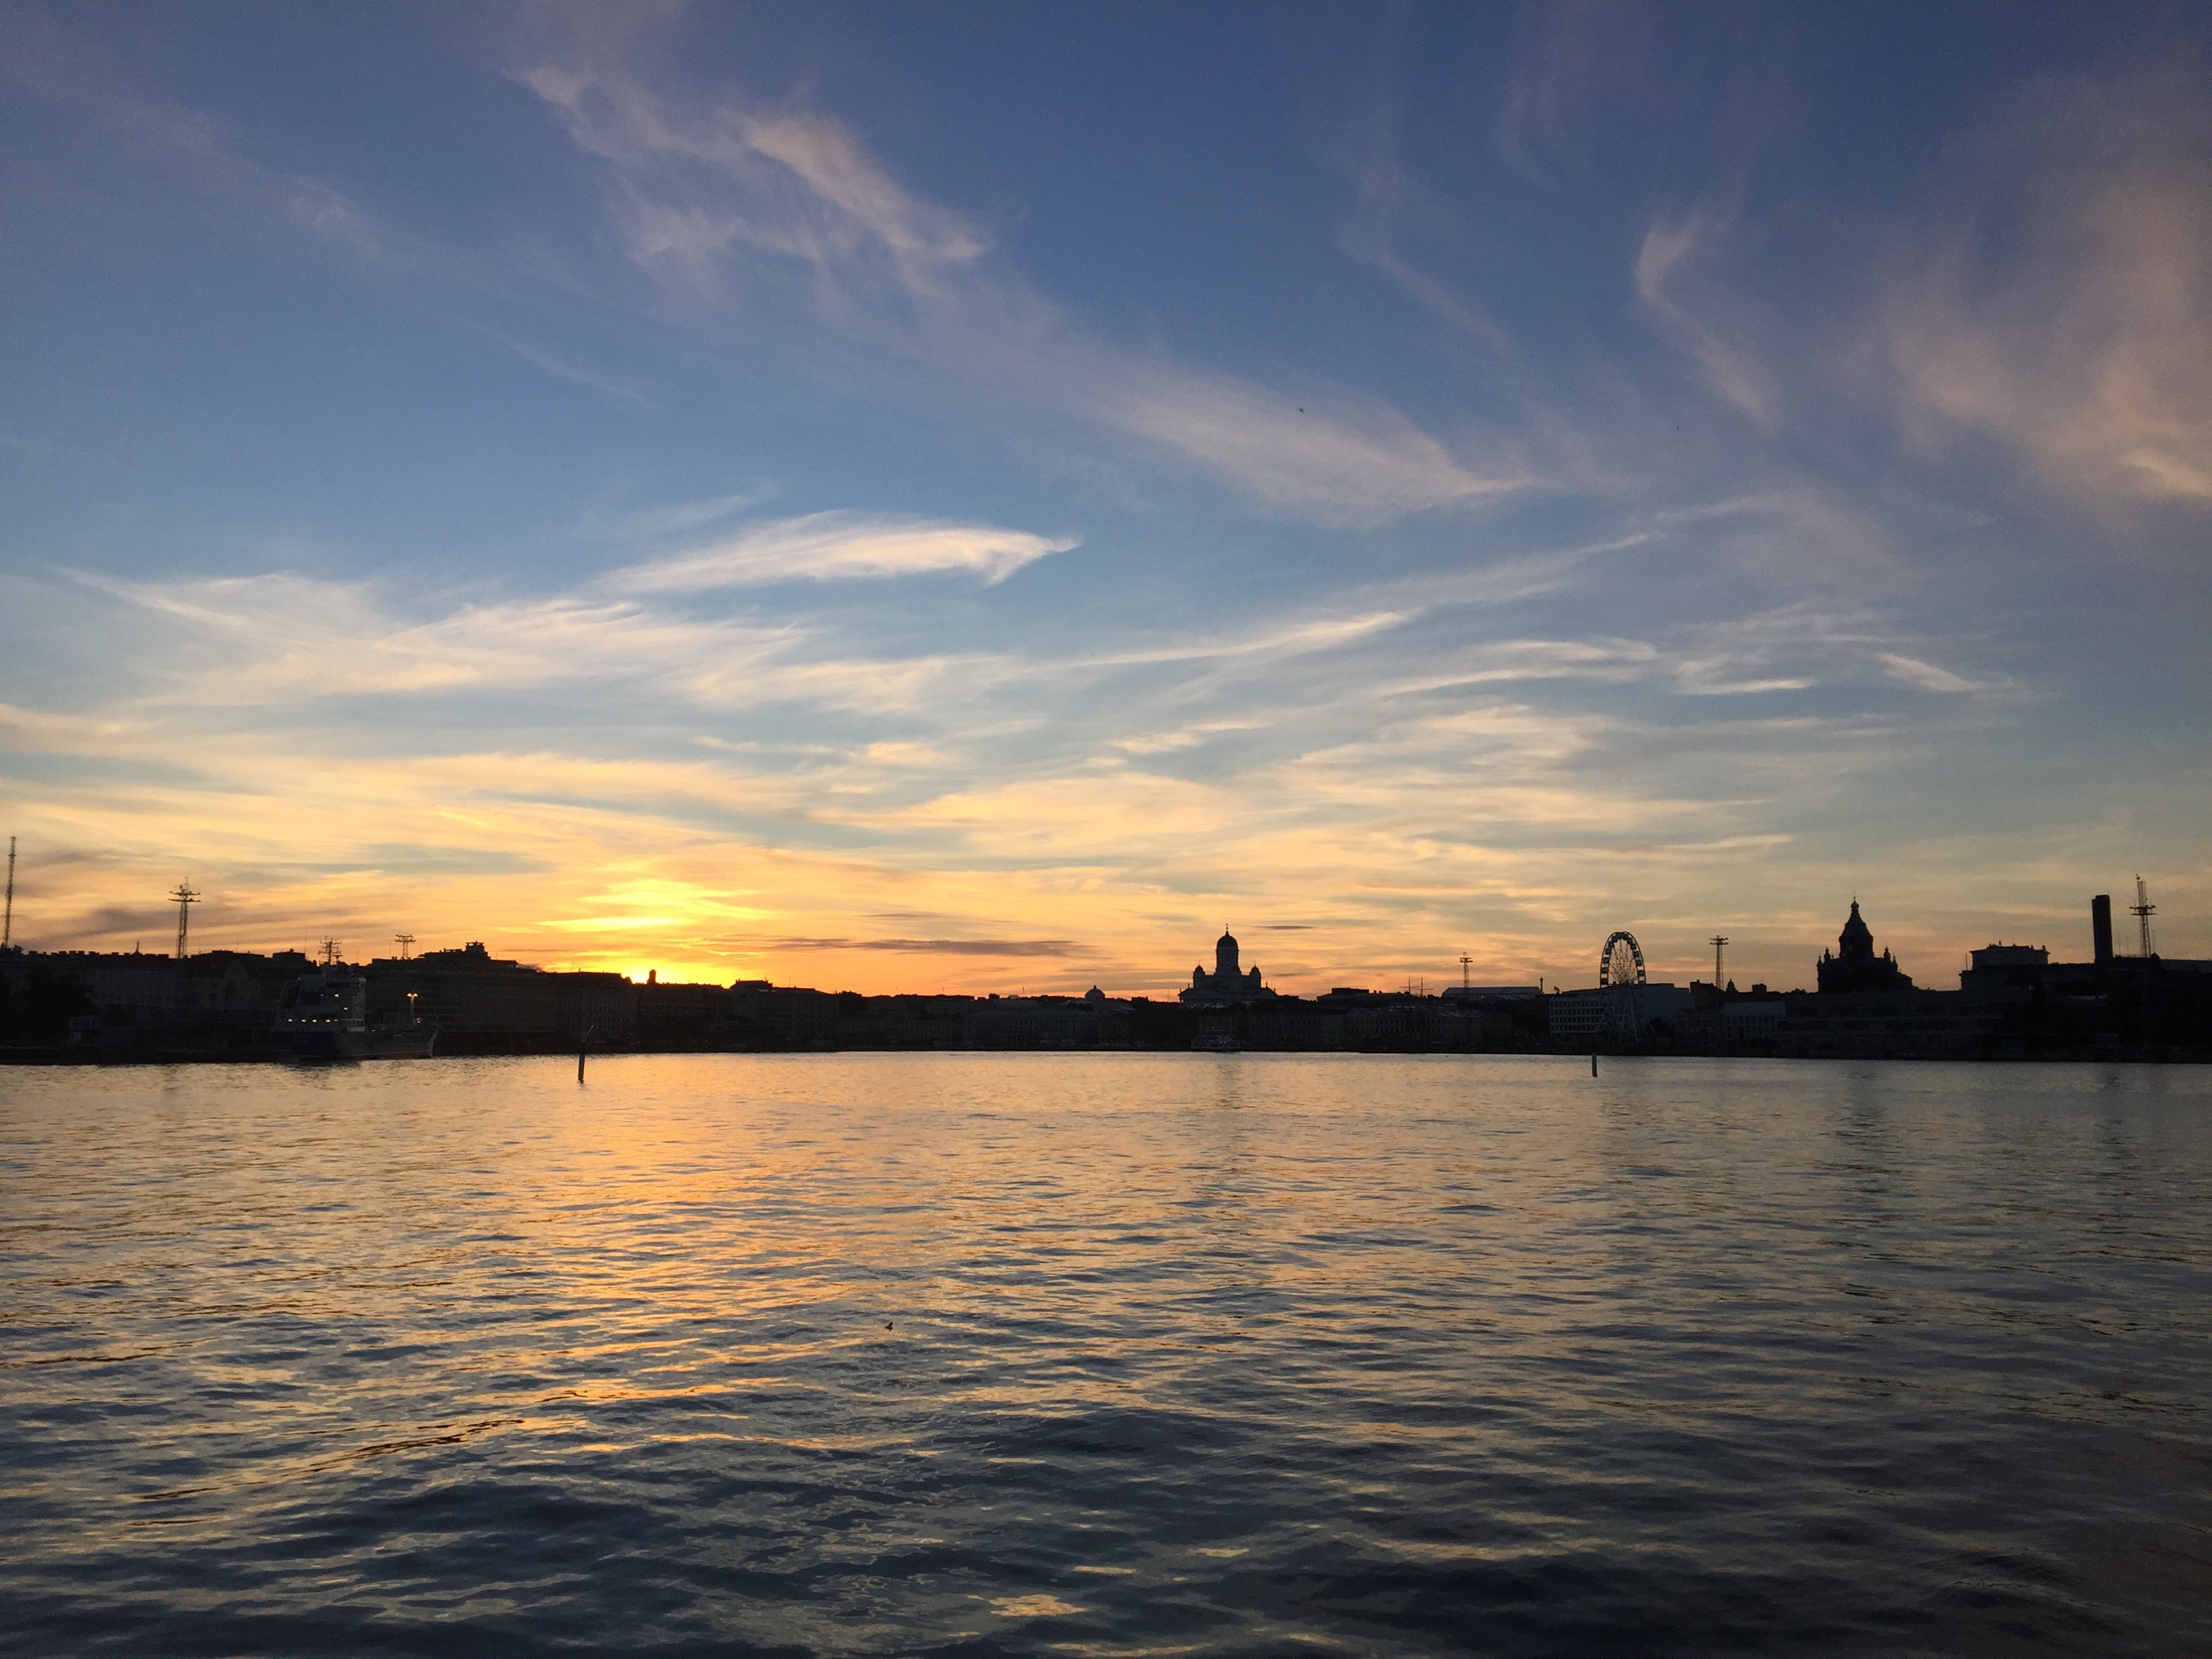
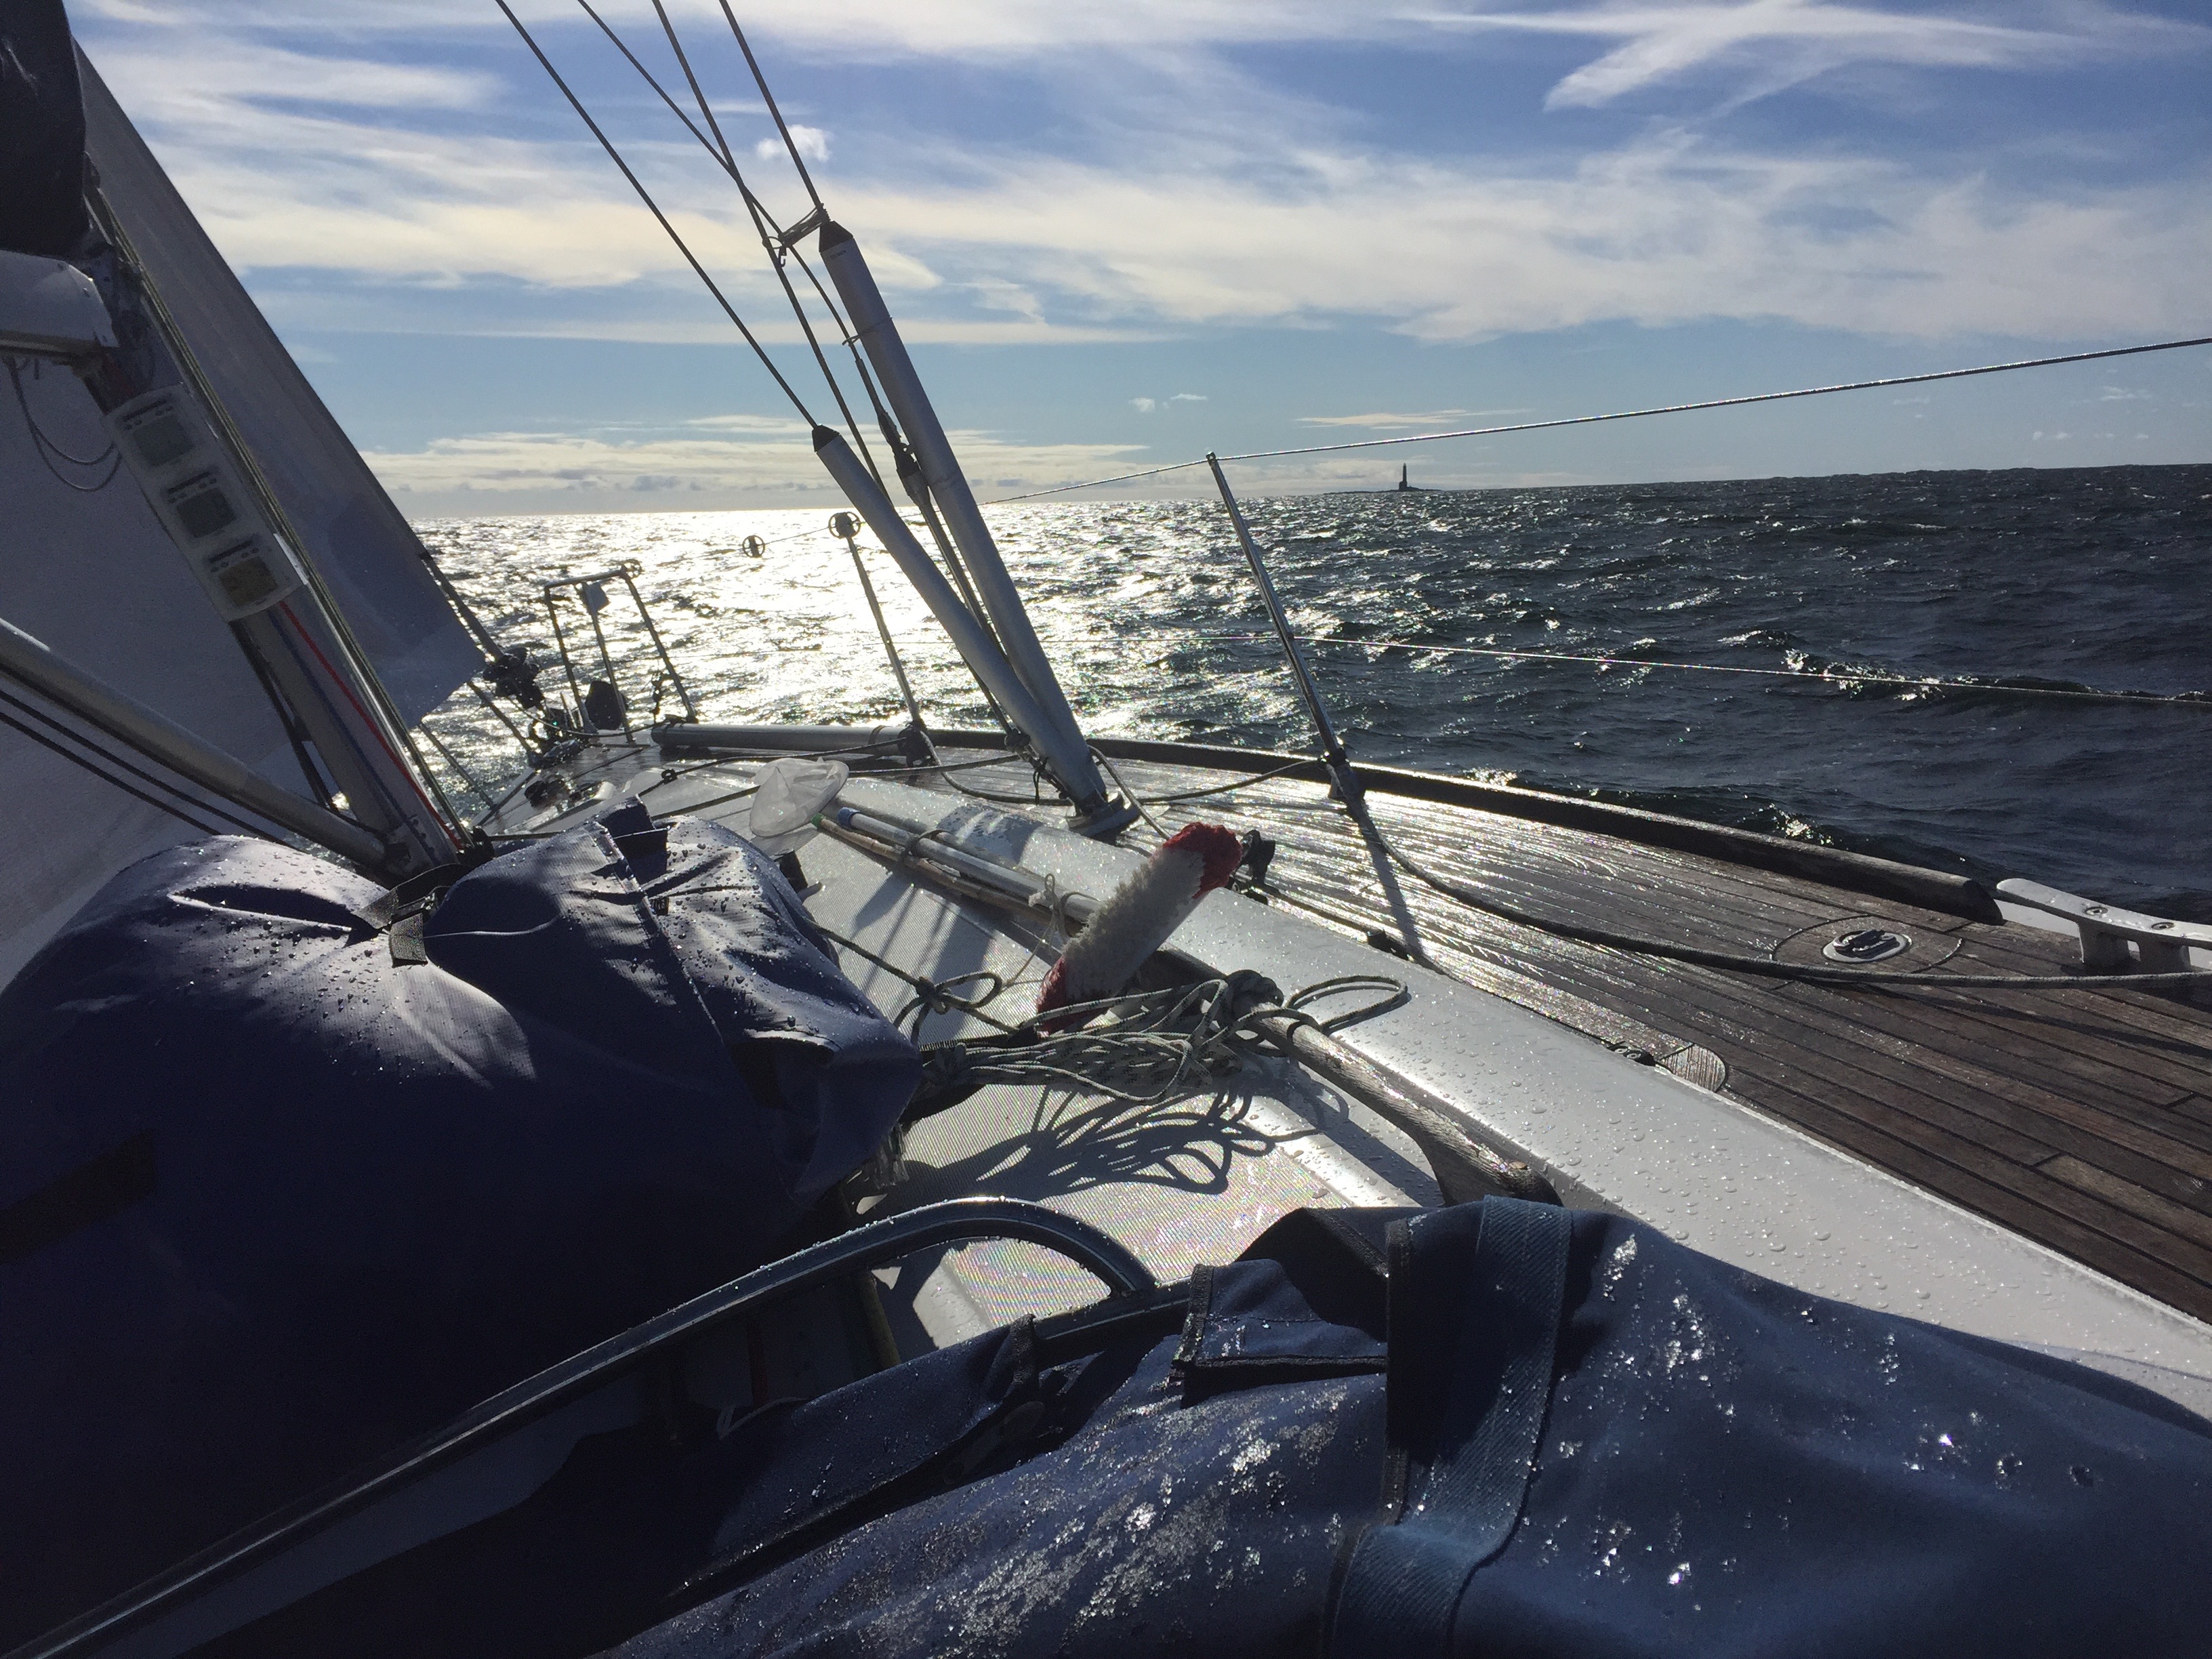
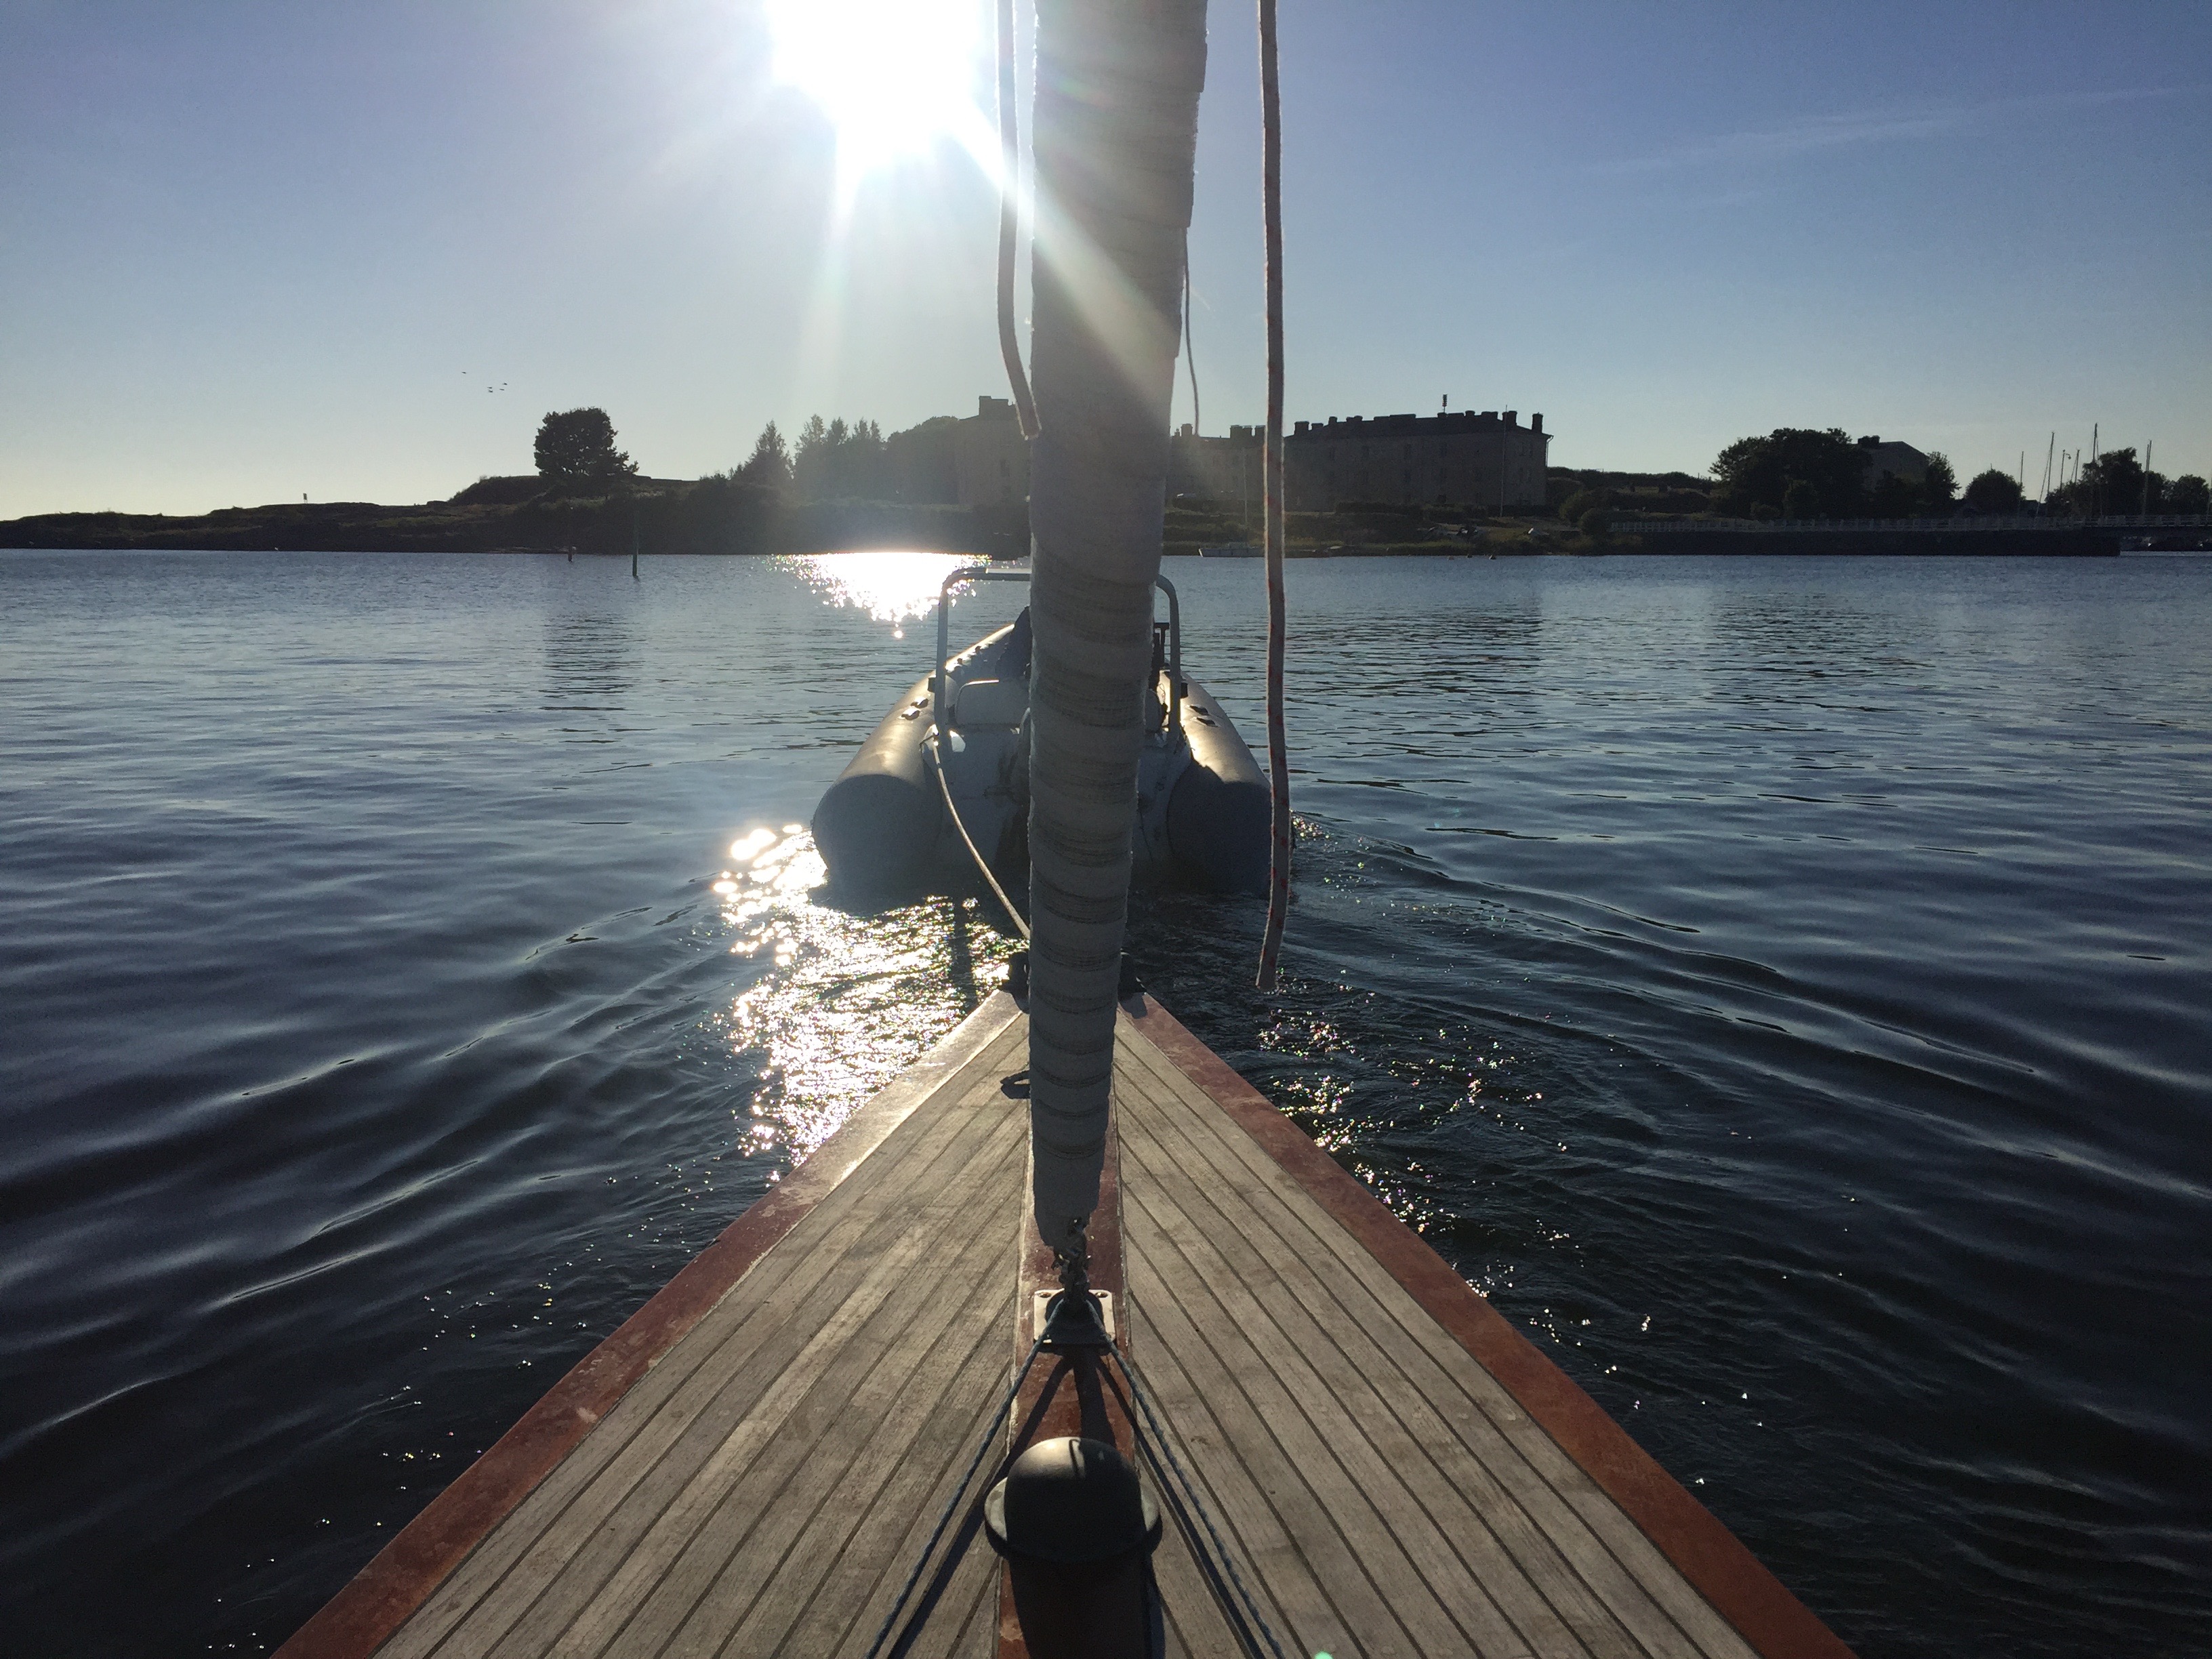
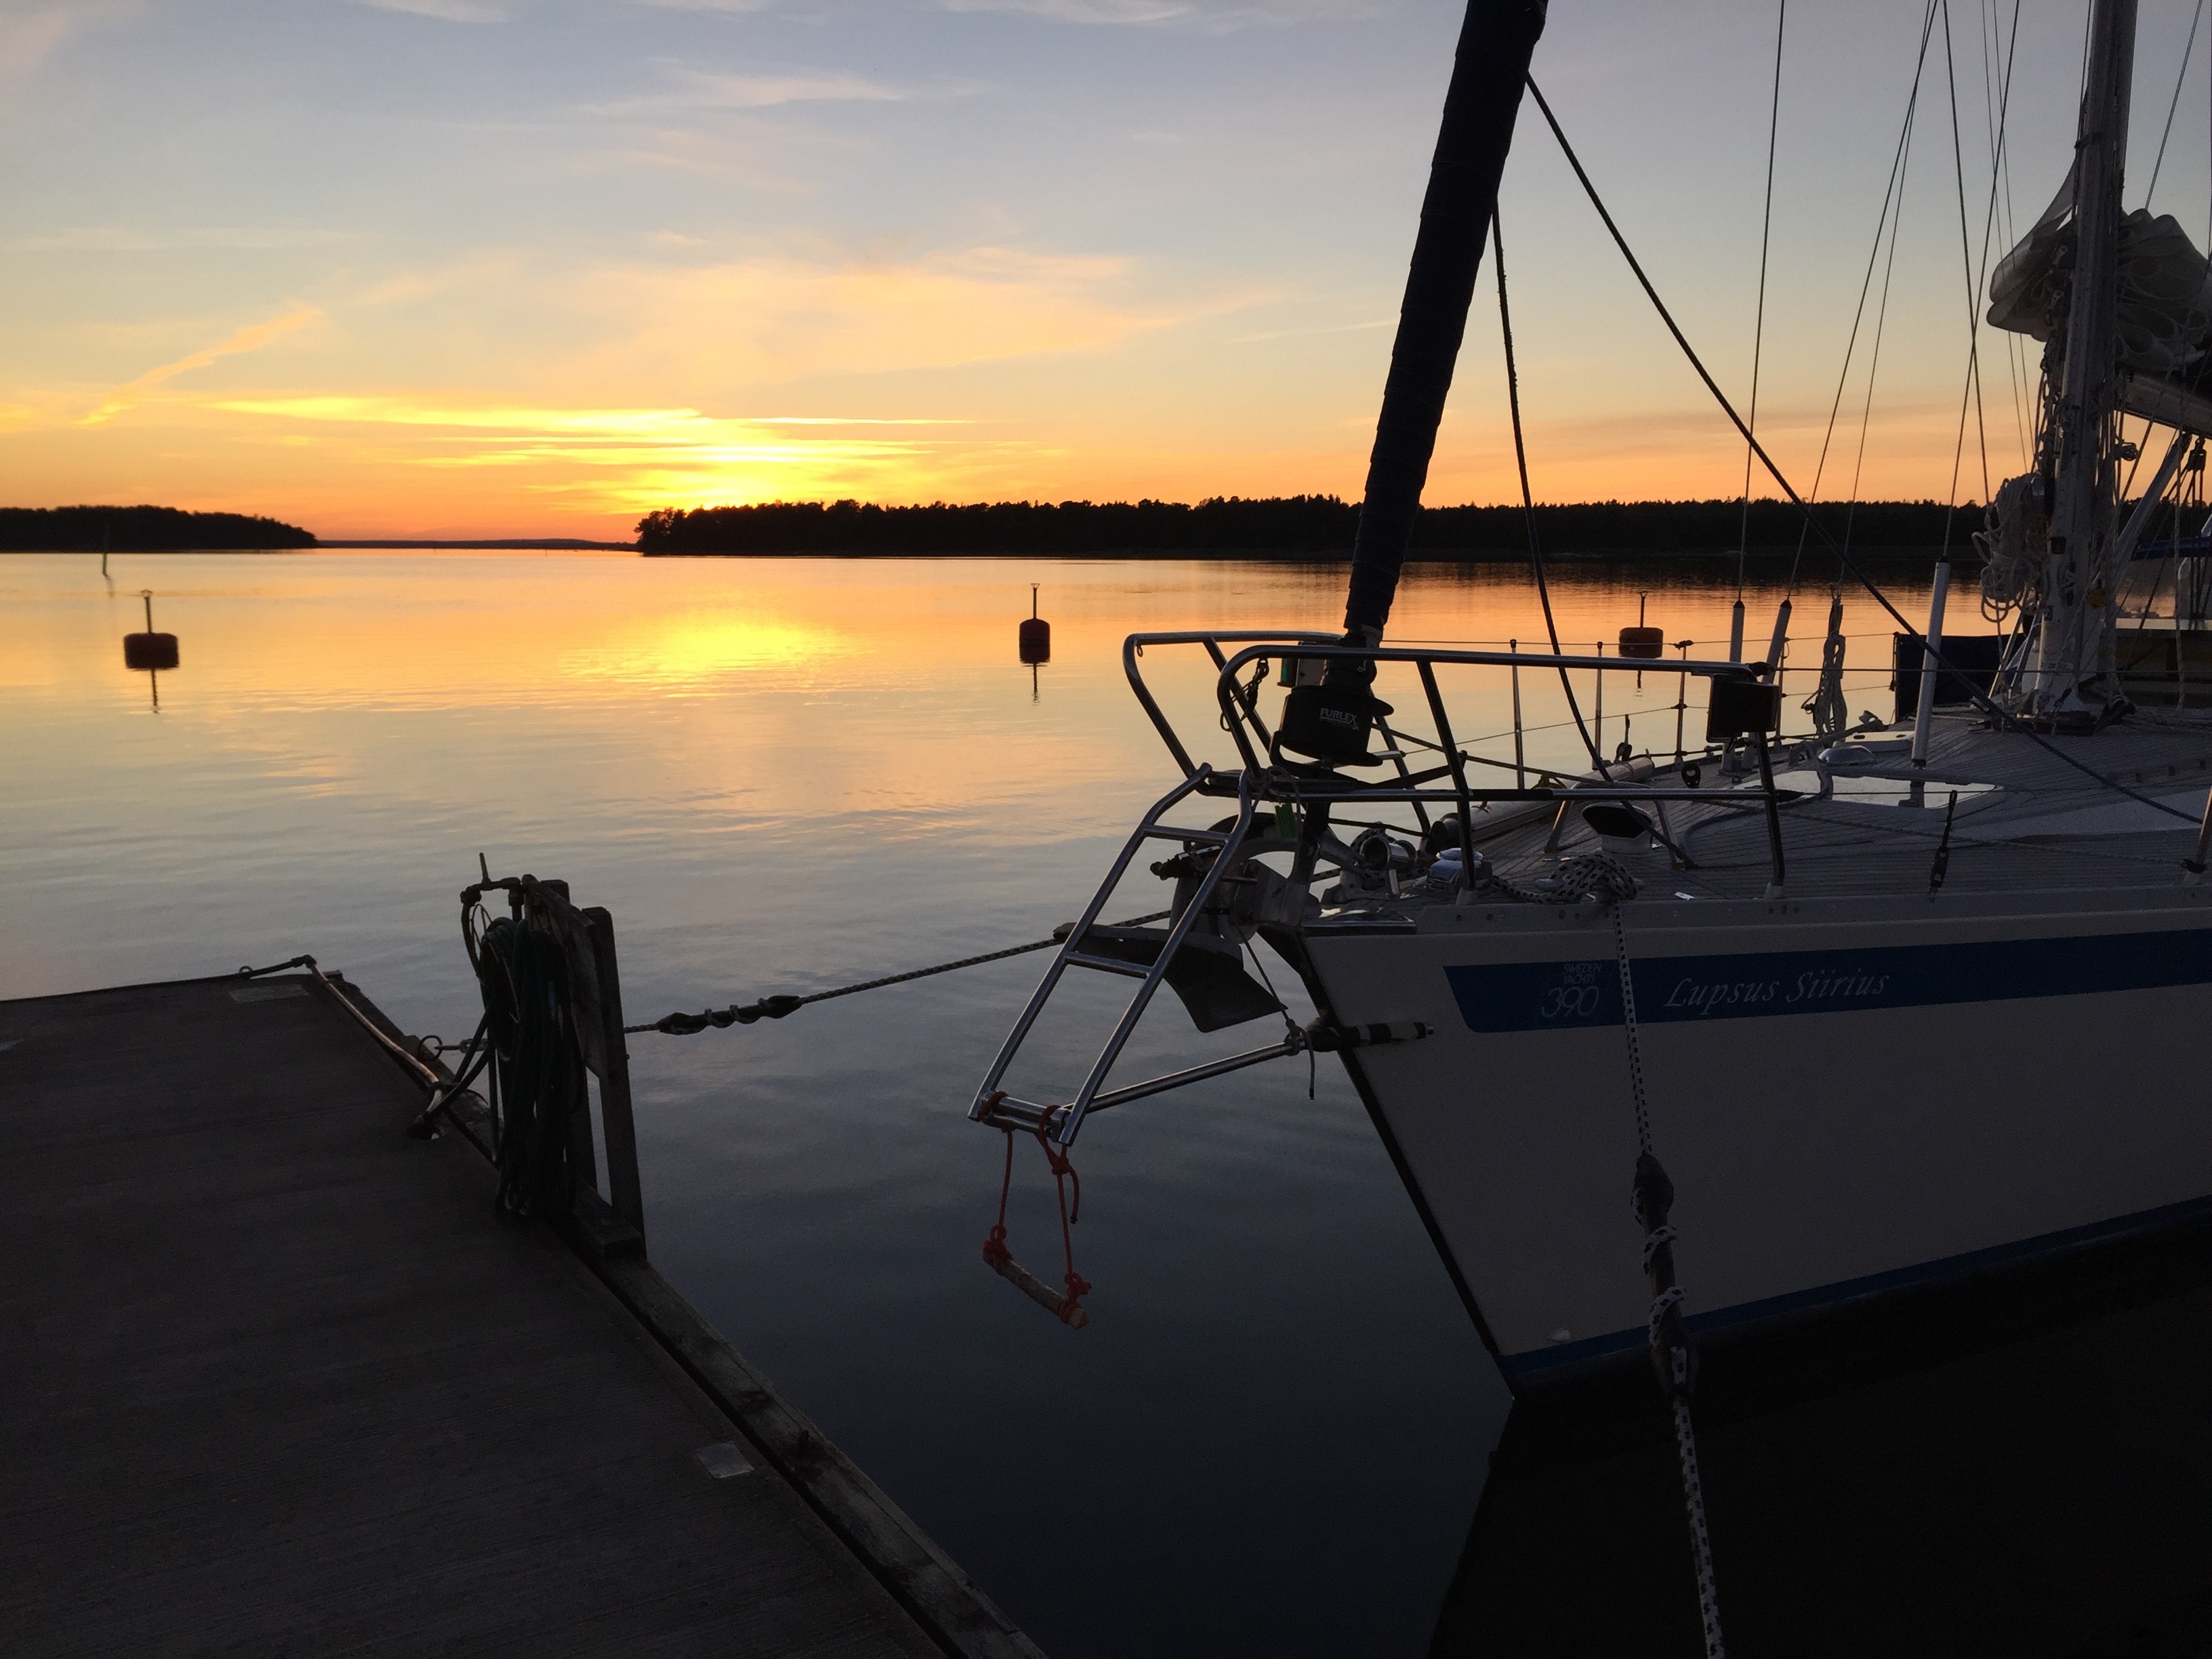
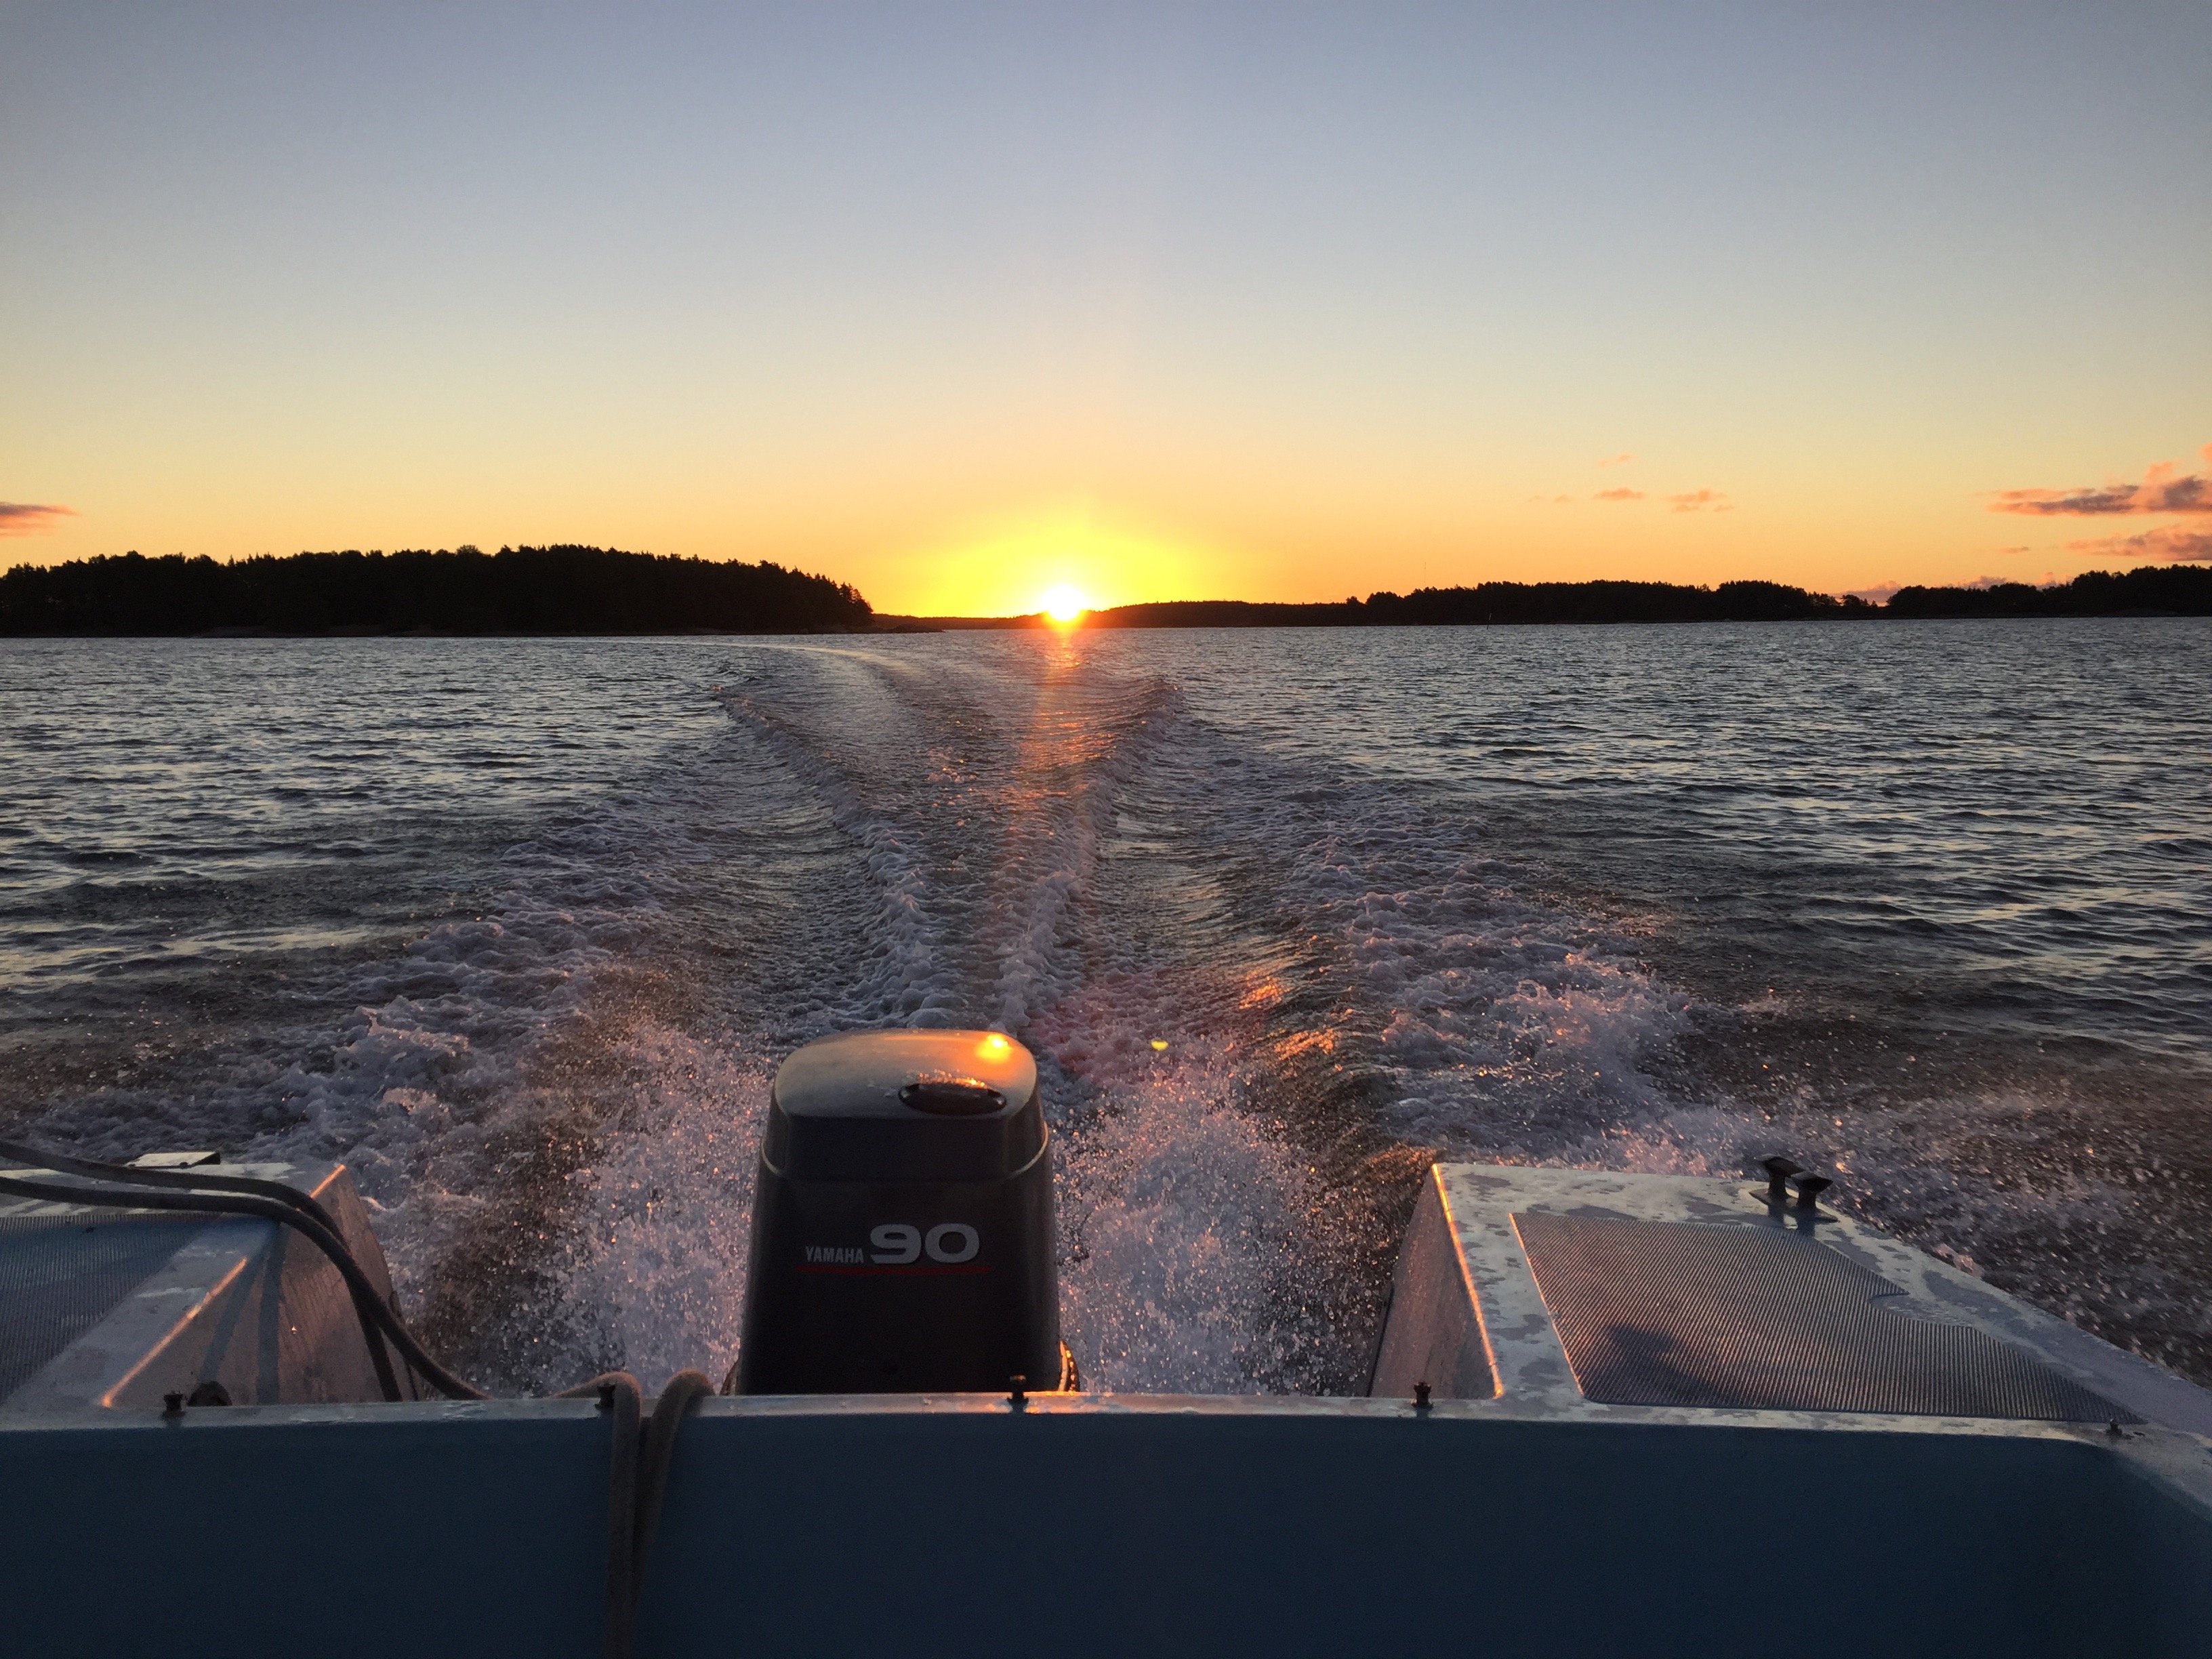
Zooming in on the tracks brings back memories from all those legs and marinas, of great sailing and even better company. It lets me relive moments like these.