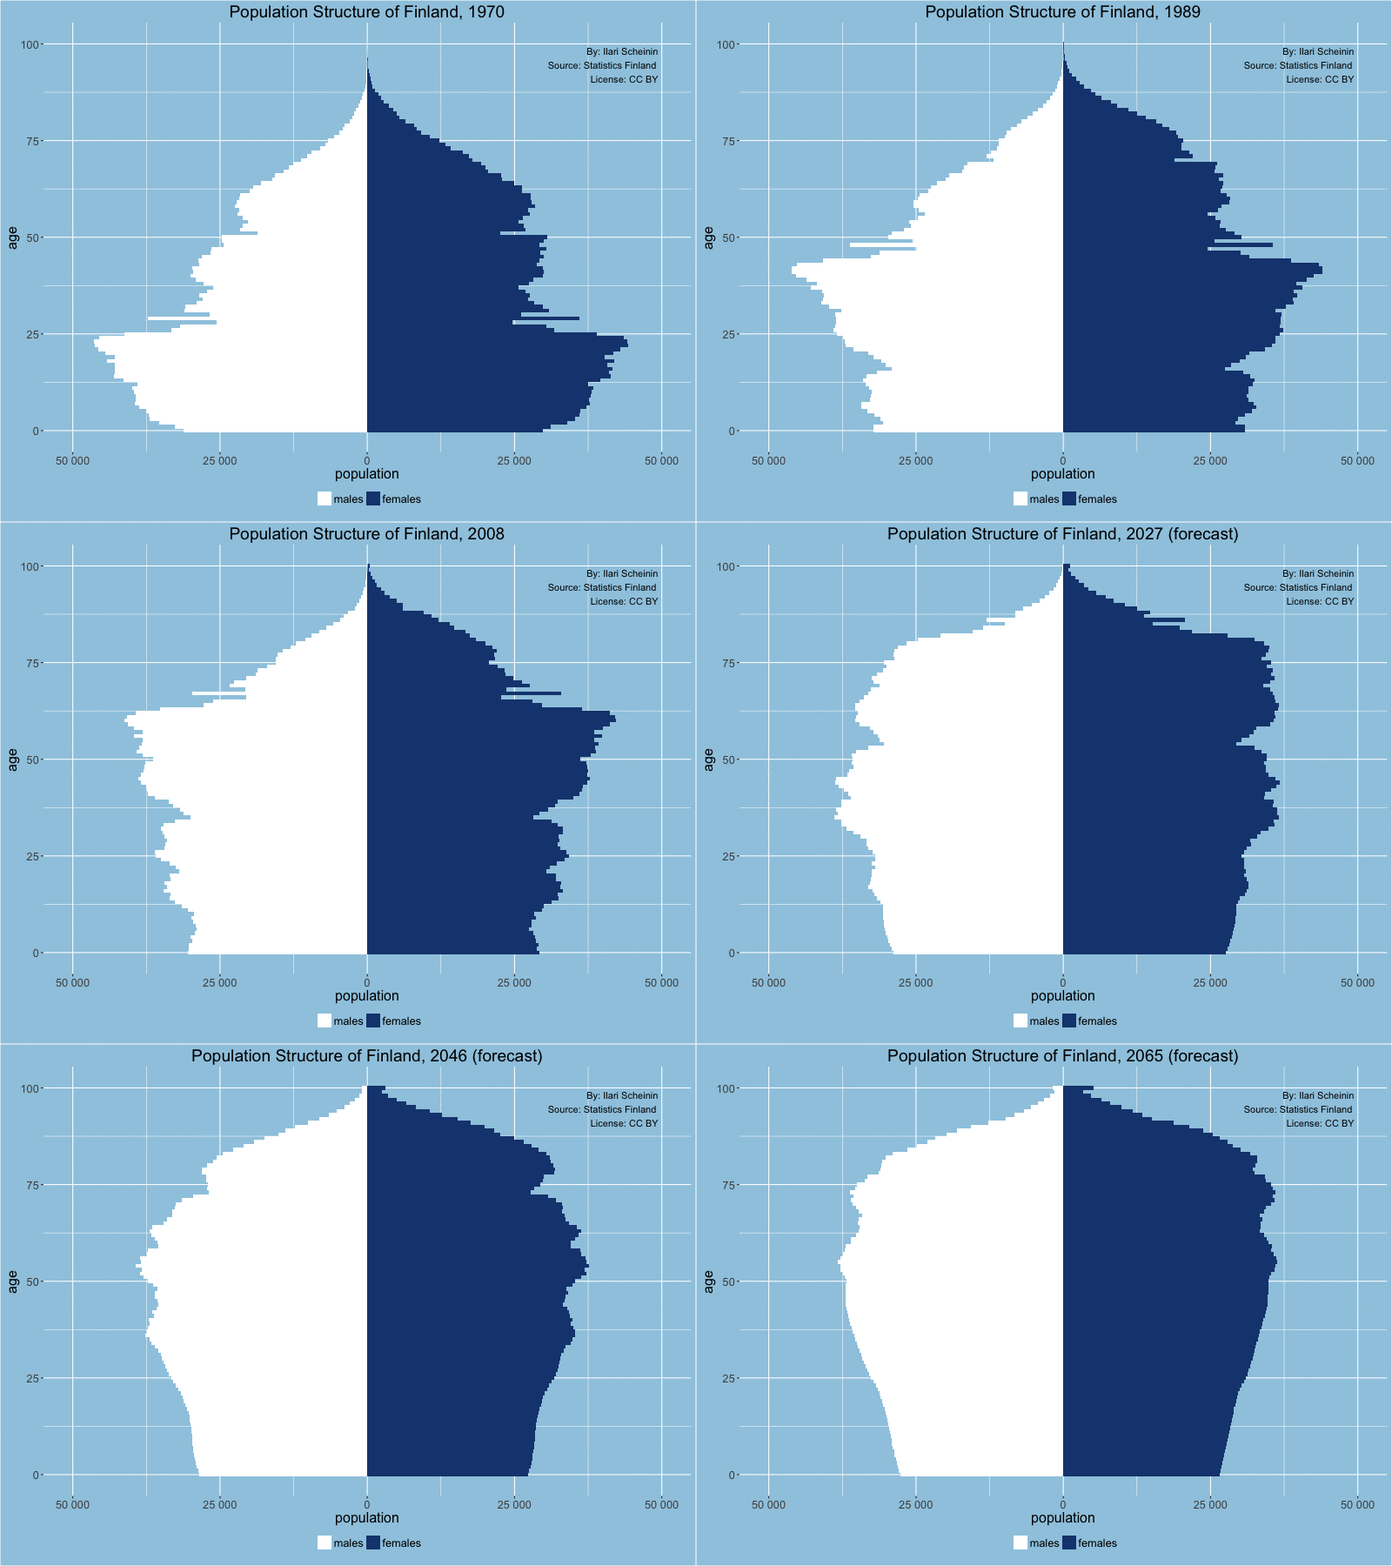
Inspired by the blog post Japan’s aging population, animated with R by David Smith and the population pyramid plot by Kyle Walker, I figured I’d try the same for Finland.
I used the pxweb package (by Måns Magnusson, Love Hansson, and Leo Lahti) to pull the corresponding data from Statistics Finland, and plotted it by making some adjustments to Kyle’s code.
The R code to generate the animation is in this gist.
