In March, I made simple visualizations of Finland’s population structure and statutory pension contributions. I also made a third one, combining the two topics, but never posted it. Here it is.
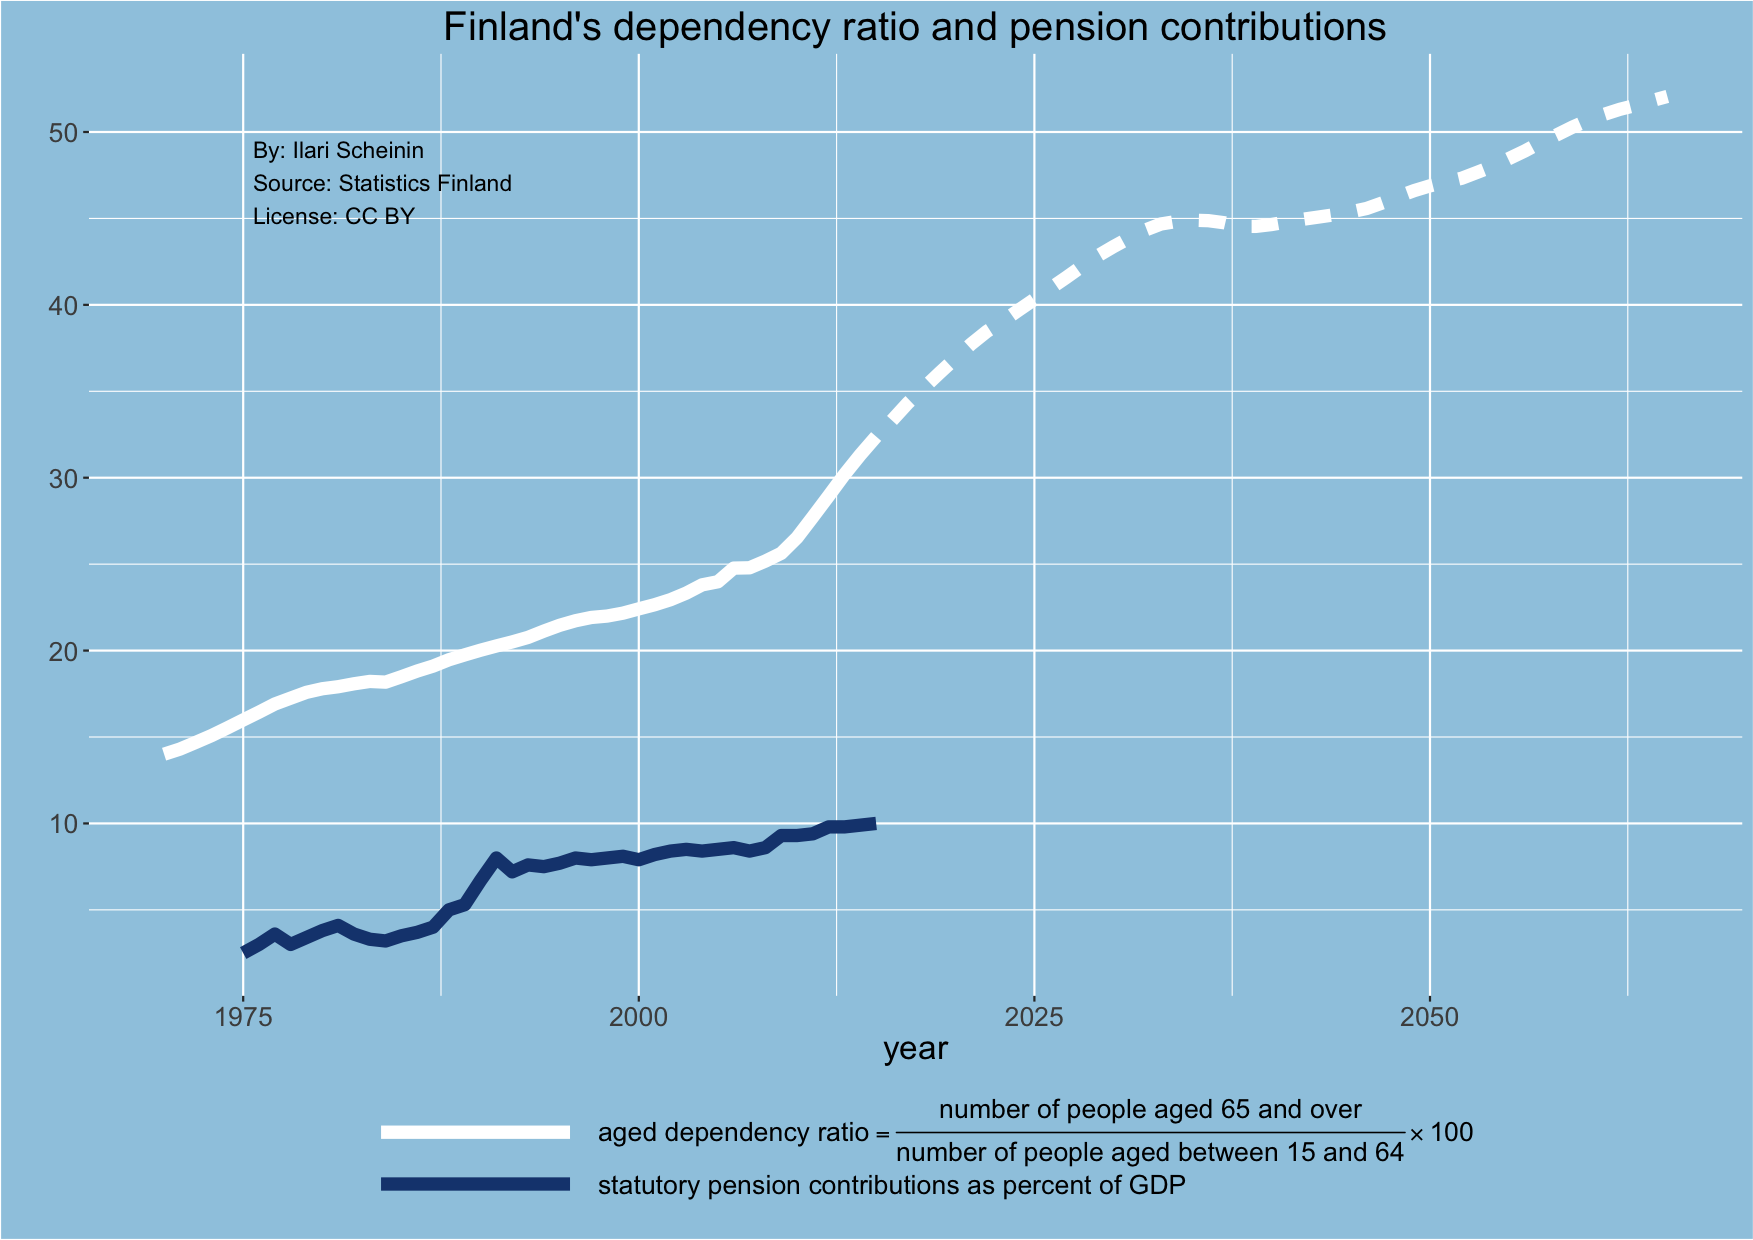
Shown in white is the aged dependency ratio, which is the proportion of people aged 65 and over, compared to those between 15 and 64. A solid line shows historical data, and future predictions are shown with a dashed one. The blue line shows statutory pension contributions as percent of GDP.
I agree with the former MP Kimmo Kiljunen in that the capital amassed in pension funds should be used. But I disagree with him when he says that they should be used to increase pensions. Instead, they should be used to keep pension contributions from skyrocketing along with the dependency ratio.
That’s the very reason why these funds were accumulated in the first place.
The code to generate the figure above is in this gist.