Another boating season is over, so I updated the shiny app of my boat trips with another year’s worth of Moves app data.
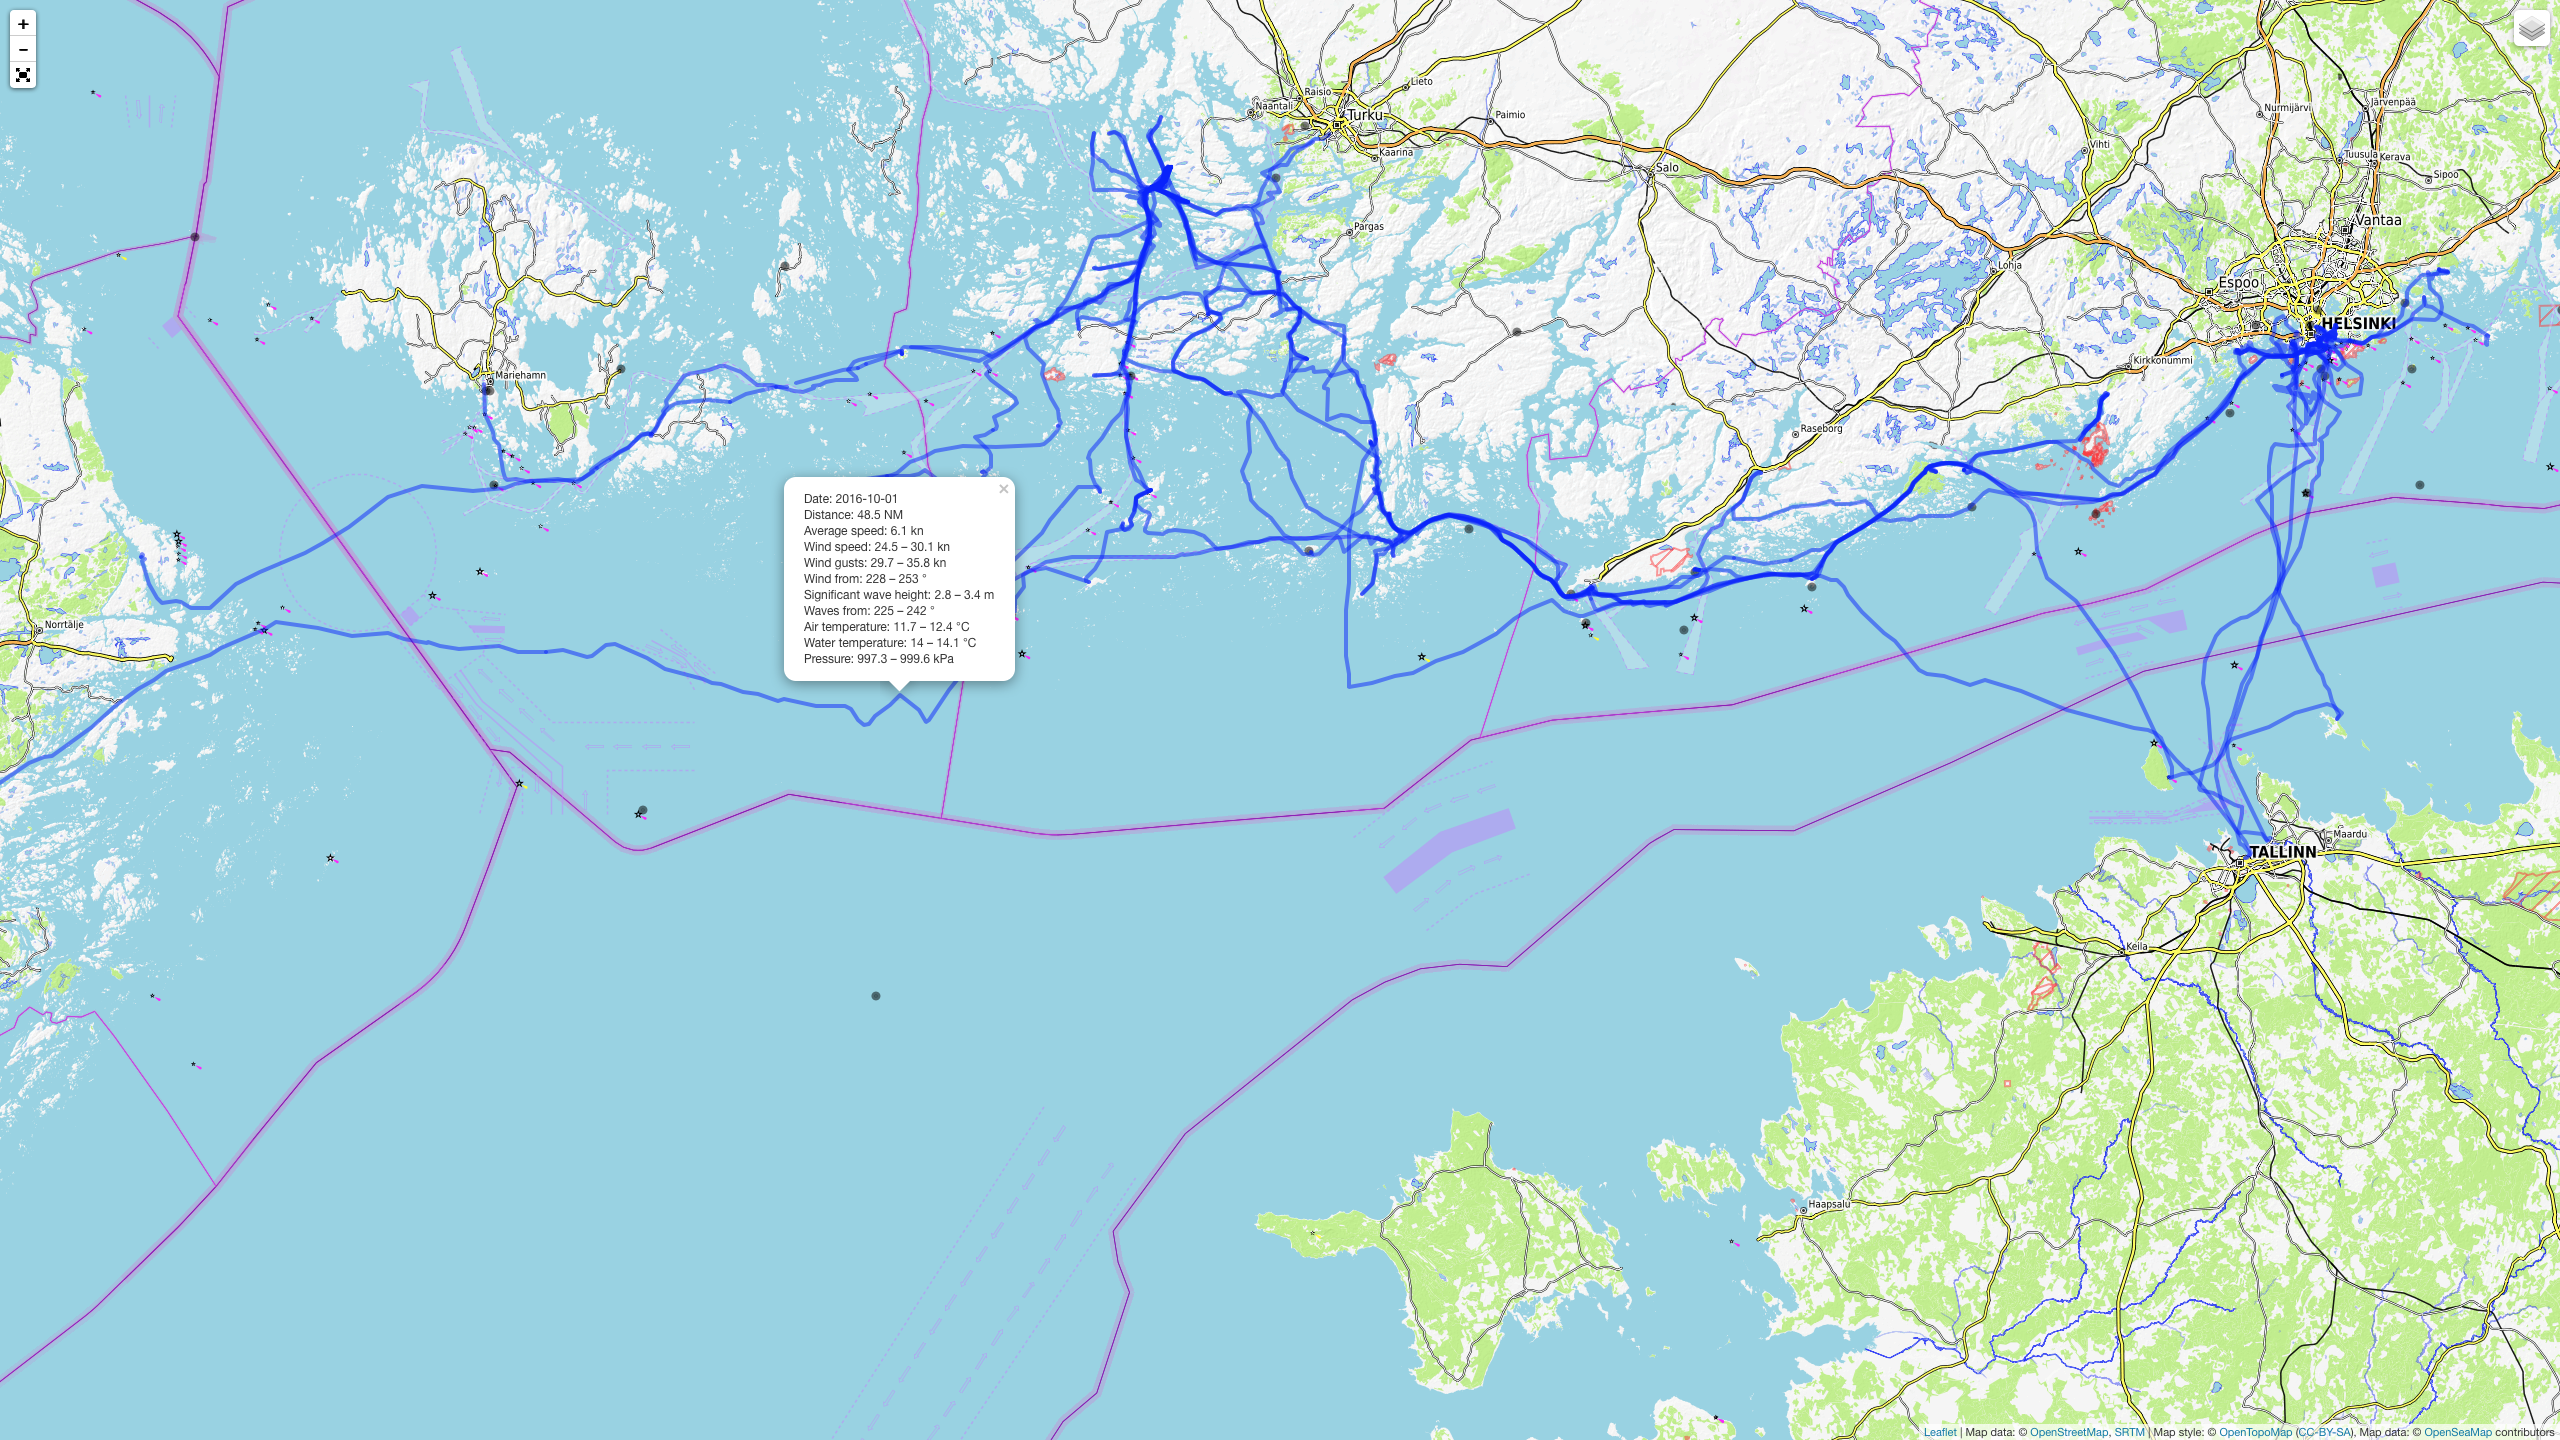
I also added weather and wave observations from the API of the Finnish Meteorological Institute. Clicking on a track brings up these details, provided the closest weather stations and wave buoys are within 30 nautical miles from the track. They are therefore only approximations, and can vary from the conditions actually experienced on the boat, depending on its location relative to the stations/buoys and nearby islands.
It should also be noted that the tracking accuracy of Moves is lower than that of proper chart plotters, which is only natural considering battery consumption. There are also clear errors when close to shore, as Moves has a tendency to place the location on known roads. Tracks and all values should therefore be taken with a grain of salt.
The source code can be found on GitHub, and the app itself is here.