Patrik Laine is playing his first season in the NHL and currently leads the league in scoring with 12 goals. With 51 shots on goal, his shooting percentage is 23.5 %. How does this number compare to great goal scores over the years? I downloaded NHL player statistics for each season from 1967–1968 onwards, which was the first year the number of shots was recorded. I then calculated career summaries for each player. But if we simply look for players with the highest shooting percentages, the first 12 all scored one goal with just one shot. Obviously these are not the best shooters, just some random flukes. In its official leaderboard for all-time career shooting percentage (S%), the NHL only counts players with at least 800 shots. This is what the top 10 looks like:
| Name | Pos | GP | G | A | PTS | S | S% | |
|---|---|---|---|---|---|---|---|---|
| 1 | Craig Simpson | LW | 634 | 247 | 250 | 497 | 1,044 | 23.7 |
| 2 | Charlie Simmer | LW | 712 | 342 | 369 | 711 | 1,531 | 22.3 |
| 3 | Paul MacLean | RW | 719 | 324 | 349 | 673 | 1,513 | 21.4 |
| 4 | Mike Bossy | RW | 752 | 573 | 553 | 1,126 | 2,705 | 21.2 |
| 5 | Yvon Lambert | LW | 683 | 206 | 273 | 479 | 1,038 | 19.8 |
| 6 | Rick Middleton | RW | 1,005 | 448 | 540 | 988 | 2,275 | 19.7 |
| 7 | Blaine Stoughton | RW | 526 | 258 | 191 | 449 | 1,322 | 19.5 |
| 8 | Darryl Sutter | LW | 406 | 161 | 118 | 279 | 829 | 19.4 |
| 9 | Rob Brown | RW | 543 | 190 | 248 | 438 | 979 | 19.4 |
| 10 | Mike Ridley | C | 866 | 292 | 466 | 758 | 1,513 | 19.3 |
Requiring a minimum number of shots (or goals) does get rid of the flukes, but how can you compare a rookie player? What kind of method could be used to take the scarcity of evidence into account, until the player catches up with the threshold? David Robinson has written a terrific series of articles for situations like this, using baseball statistics as an example. I’ll follow one of his tutorials and use empirical Bayes estimation to obtain a more reliable picture. In short, we’ll first use all players’ data to obtain an estimate for a beta prior, and then use each player’s own data to update the prior based on individual evidence. Put another way, we start by assuming everyone is average, and if and only if they show more and more evidence to the contrary, we start to gradually consider them as special. For a more much better description, please see the original blog post. All R code is also adapted from that post.
Before we get to estimation of the beta prior, let’s first check if we should use all of the available data or only a subset. Since in this case we are estimating only one prior, we would like all players to come from a single distribution. As the gameplay has surely changed a bit over the years, let’s look at the overall shooting percentages over the 49 seasons. Also, since defensemen normally play futher away from the opponent’s net than forwards, player position is likely to have an effect as well. Let’s look at shooting percentages separately for each position (excluding players with less than ten goals).
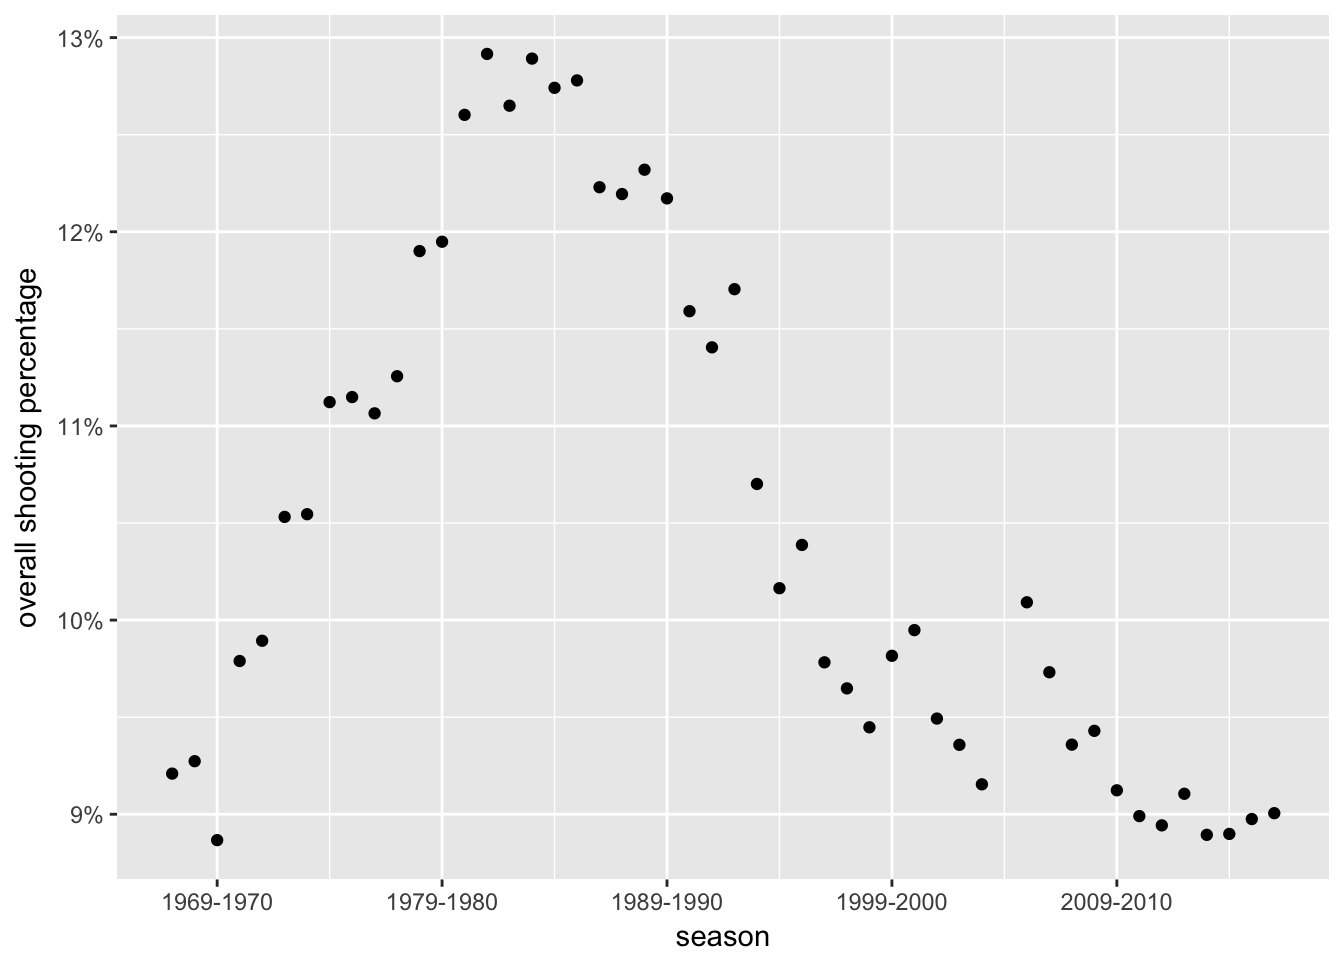
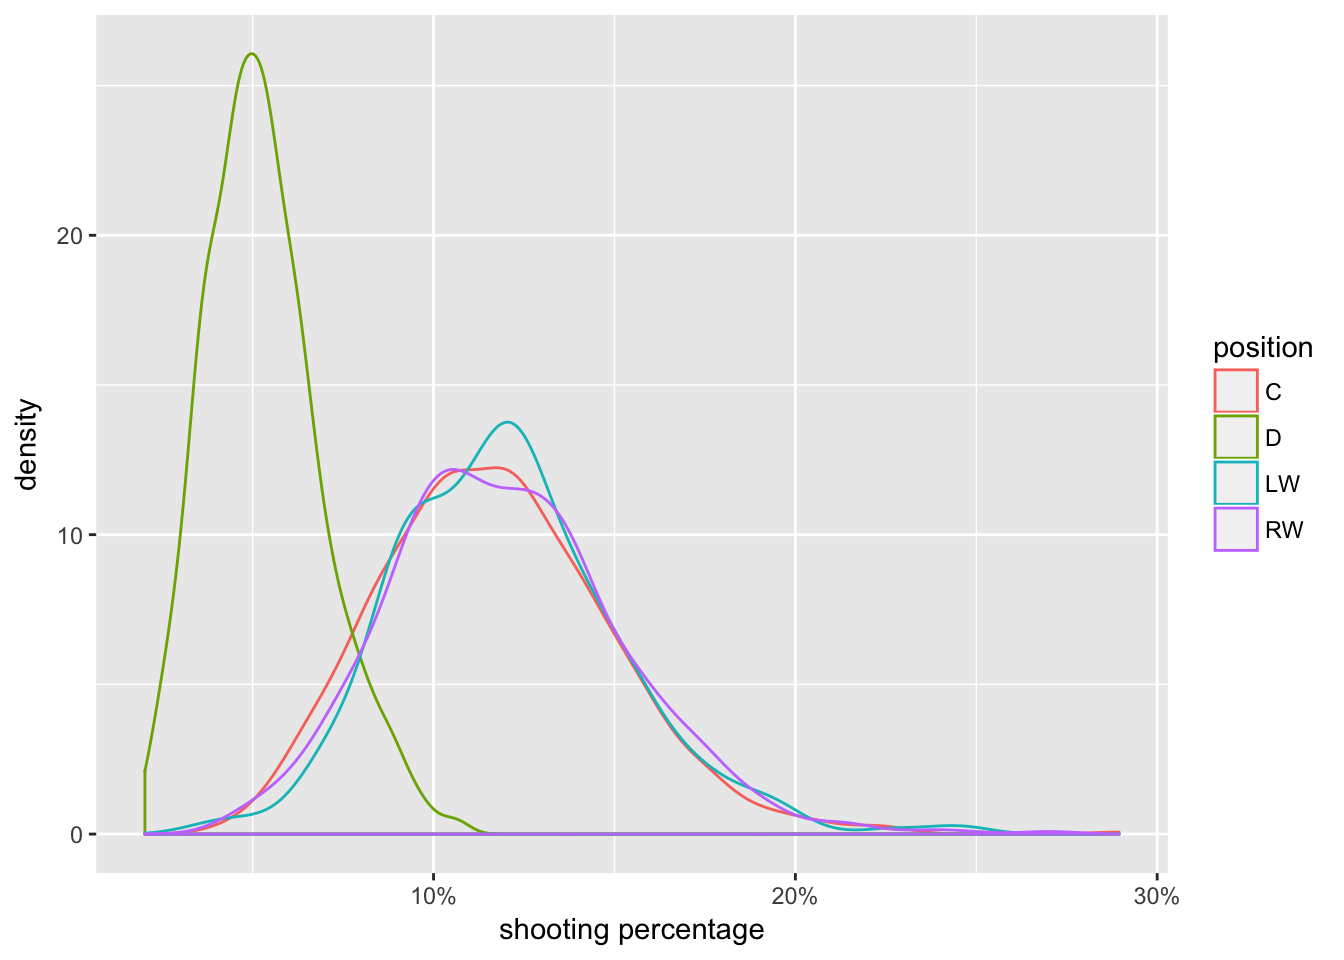
As we can see, shooting percentages used to be much higher around the 1980s. For this simple analysis, I’ll only include data from season 1996–1997 onwards. I’ll also leave out the defensemen, as they tend to have lower shooting percentages. (I hope to write follow-ups posts later with all of the data included and handled properly, either using some of the other approaches David has described for empirical Bayes, with a standard Bayesian analysis, or maybe even both.)
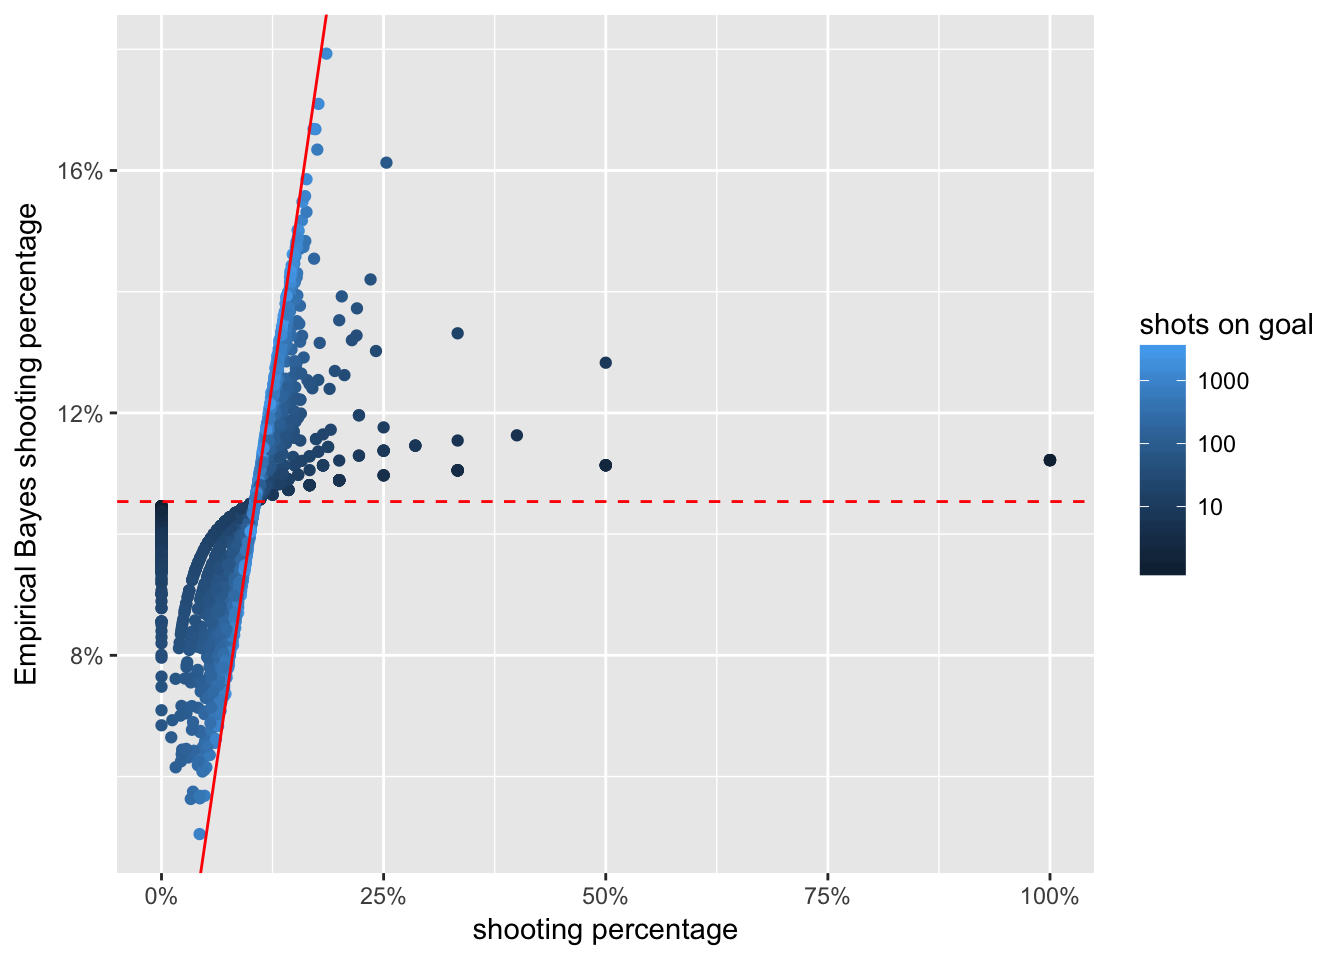
Overall, the average shooting percentage for all forwards over the last 20 seasons is 11.0 %. Next, let’s estimate a beta prior from the data and see how it fits:

Shooting percentages can now be adjusted using this prior. This will shrink individual players’ estimates towards the horizontal dashed line. The more evidence there is for an individual (the brighter the blue dot), the more we trust it. The darker dots show a lot of shrinkage, whereas the light ones are much closer to the diagonal red line, which marks the case of no shrinkage at all.
Finally, let’s look at the ranking (from season 1996–1997 onwards) for shooting percentage estimated with empirical Bayes (EB). Patrik Laine currently sits at number 40, and only time will tell where he moves on that list. But what we do know today, is that he is one of only four 18-year-olds to score two hat tricks in the NHL (others being Jack Hamilton, Dale Hawerchuk, and Trevor Linden), and he still has the rest of the regular season to hunt for a third one before his 19th birthday on April 19th, 2017.
| Name | Pos | GP | G | A | PTS | S | S% | EB | |
|---|---|---|---|---|---|---|---|---|---|
| 1 | Alex Tanguay | LW | 1,088 | 283 | 580 | 863 | 1,525 | 18.6 | 17.9 |
| 2 | Andrew Brunette | LW | 1,099 | 265 | 462 | 727 | 1,500 | 17.7 | 17.1 |
| 3 | Steven Stamkos | C | 586 | 321 | 261 | 582 | 1,876 | 17.1 | 16.7 |
| 4 | Mark Parrish | RW | 722 | 216 | 171 | 387 | 1,247 | 17.3 | 16.7 |
| 5 | Dmitri Khristich | C | 420 | 111 | 171 | 282 | 633 | 17.5 | 16.3 |
| 6 | Mike Ridley | C | 75 | 20 | 32 | 52 | 79 | 25.3 | 16.1 |
| 7 | Tomas Holmstrom | LW | 1,026 | 243 | 287 | 530 | 1,489 | 16.3 | 15.9 |
| 8 | Gary Roberts | LW | 639 | 181 | 224 | 405 | 1,120 | 16.2 | 15.6 |
| 9 | Brenden Morrow | LW | 991 | 265 | 310 | 575 | 1,670 | 15.9 | 15.5 |
| 10 | Jan Hrdina | C | 513 | 101 | 196 | 297 | 619 | 16.3 | 15.3 |
| 11 | Jason Allison | C | 519 | 152 | 326 | 478 | 962 | 15.8 | 15.2 |
| 12 | Ziggy Palffy | RW | 565 | 276 | 333 | 609 | 1,799 | 15.3 | 15.0 |
| 13 | John LeClair | LW | 624 | 281 | 274 | 555 | 1,833 | 15.3 | 15.0 |
| 14 | Alexander Mogilny | RW | 530 | 207 | 274 | 481 | 1,341 | 15.4 | 15.0 |
| 15 | Pierre Turgeon | C | 622 | 197 | 351 | 548 | 1,285 | 15.3 | 14.9 |
| 16 | Tyler Bozak | C | 451 | 112 | 169 | 281 | 717 | 15.6 | 14.8 |
| 17 | Sergei Kostitsyn | LW | 353 | 67 | 109 | 176 | 414 | 16.2 | 14.8 |
| 18 | Joe Nieuwendyk | C | 628 | 236 | 242 | 478 | 1,555 | 15.2 | 14.8 |
| 19 | Anson Carter | RW | 674 | 202 | 219 | 421 | 1,331 | 15.2 | 14.8 |
| 20 | Tony Hrkac | C | 425 | 70 | 105 | 175 | 438 | 16.0 | 14.7 |
| 21 | Mark Messier | C | 555 | 155 | 264 | 419 | 1,015 | 15.3 | 14.7 |
| 22 | Yanic Perreault | C | 742 | 217 | 237 | 454 | 1,436 | 15.1 | 14.7 |
| 23 | Adam Deadmarsh | RW | 441 | 154 | 154 | 308 | 1,010 | 15.2 | 14.7 |
| 24 | Adam Henrique | C | 364 | 101 | 109 | 210 | 650 | 15.5 | 14.7 |
| 25 | Teemu Selanne | RW | 1,192 | 521 | 594 | 1,115 | 3,528 | 14.8 | 14.6 |
| 26 | Jonathan Toews | C | 662 | 255 | 321 | 576 | 1,710 | 14.9 | 14.6 |
| 27 | Jiri Hudler | C | 680 | 161 | 256 | 417 | 1,068 | 15.1 | 14.6 |
| 28 | Paul Byron | C | 217 | 34 | 43 | 77 | 198 | 17.2 | 14.5 |
| 29 | Brad Marchand | C | 470 | 158 | 147 | 305 | 1,057 | 14.9 | 14.5 |
| 30 | Sidney Crosby | C | 716 | 348 | 603 | 951 | 2,376 | 14.6 | 14.4 |
| 31 | Mike Sillinger | C | 831 | 210 | 234 | 444 | 1,420 | 14.8 | 14.4 |
| 32 | Keith Tkachuk | LW | 893 | 394 | 382 | 776 | 2,713 | 14.5 | 14.3 |
| 33 | Peter Forsberg | C | 579 | 204 | 515 | 719 | 1,390 | 14.7 | 14.3 |
| 34 | Milan Lucic | LW | 664 | 164 | 242 | 406 | 1,111 | 14.8 | 14.3 |
| 35 | Dany Heatley | RW | 869 | 372 | 419 | 791 | 2,565 | 14.5 | 14.3 |
| 36 | David Desharnais | C | 420 | 78 | 168 | 246 | 511 | 15.3 | 14.3 |
| 37 | Martin Straka | LW | 714 | 206 | 370 | 576 | 1,408 | 14.6 | 14.3 |
| 38 | Thomas Vanek | LW | 824 | 320 | 337 | 657 | 2,213 | 14.5 | 14.2 |
| 39 | Stephane Matteau | LW | 471 | 75 | 88 | 163 | 493 | 15.2 | 14.2 |
| 40 | Patrik Laine | RW | 18 | 12 | 5 | 17 | 51 | 23.5 | 14.2 |