When I was at the Recurse Center, I wanted to try the caret package for R. It provides a unified interface for training various types of classification and regression models, and parameter tuning through resampling. I needed a project to work on, and since I love hockey and the Stanley Cup playoffs were just starting, it was a natural choice.
The source code is all on GitHub, and is split into four R Markdown documents: scrape raw data, process data, train models, and make predictions. I’ll present a short summary here, and more details can be found behind those links. The repository also contains a Makefile to replicate the analysis. Random seeds are specified in the code to make it fully reproducible.
First, I used the nhlscrapr package to scrape play-by-play data from NHL.com starting from the 2002-2003 season. Then, I used dplyr to calculate some summary statistics. For each game, I calculated the following statistics for both the home and away teams:
- the proportion of goals scored, i.e. “goals scored / (goals scored + goals against)”
- the proportion of shots
- the proportion of faceoffs won
- the proportion of penalties
- power play, i.e. “power play goals scored / penalties for the other team”
- penalty kill, i.e. “power play goals against / penalties for own team”
I’m sure many more useful predictor variables could be derived from the play-by-play data, which in turn would result in more accurate predictions. But since this was mainly an exercise to try out caret, these variables will suffice for now.
For each season, I then calculated the average performance of each team, separately for when they were playing at home and on the road. Here’s an example of away performance for six teams from the 2002-2003 season:
| season | team | goals | shots | faceoffs | penalties | pp | pk |
|---|---|---|---|---|---|---|---|
| 20022003 | ANA | 0.480 | 0.477 | 0.544 | 0.517 | 0.159 | 0.095 |
| 20022003 | ATL | 0.433 | 0.434 | 0.467 | 0.504 | 0.147 | 0.139 |
| 20022003 | BOS | 0.422 | 0.503 | 0.481 | 0.555 | 0.137 | 0.103 |
| 20022003 | BUF | 0.416 | 0.482 | 0.493 | 0.526 | 0.118 | 0.119 |
| 20022003 | CAR | 0.384 | 0.492 | 0.512 | 0.514 | 0.105 | 0.169 |
| 20022003 | CBJ | 0.376 | 0.432 | 0.472 | 0.511 | 0.110 | 0.104 |
Next, I took the outcomes of all playoff series from the past 11 seasons, and calculated two deltas to be used as explanatory variables. I calculated the difference between the home team’s home performance and the away team’s away performance, and also the home team’s away performance and the away team’s home performance. This was to capture how the two teams would perform at the two arenas for the series.
I then used caret to train five different types of statistical models on this training data. The methods I included were generalized linear model, linear discriminant analysis, neural network, random forest, and support vector machine with a linear kernel. For each, model parameters were tuned with 10-fold cross-validation, which was repeated 10 times. Parameter values with the best overall accuracy were used to fit the final model with all of the training data.
For my predictions, instead of picking just one of the five fitted models, I used all of them. For each playoff series, I used a majority vote from all five models to pick the winner. (That’s why I fitted an odd number of models.) The predictions are below, with the predicted winner in bold:
Round 1
- Pittsburg Penguins at New York Rangers
- Ottawa Senators at Montreal Canadians
- Detroit Red Wings at Tampa Bay Lightning
- New York Islanders at Washington Capitals
- Winnipeg Jets at Anaheim Ducks
- Minnesota Wild at St. Louis Blues
- Chicago Blackhawks at Nashville Predators
- Calgary Flames at Vancouver Canucks
Round 2
- New York Islanders at New York Rangers
- Tampa Bay Lightning at Montreal Canadians
- Calgary Flames at Anaheim Ducks
- Chicago Blackhawks at St. Louis Blues
Round 3 – Conference Finals
- Montreal Canadians at New York Rangers
- Chicago Blackhawks at Anaheim Ducks
Round 4 – Stanley Cup Finals
- Chicago Blackhawks at New York Rangers
My prediction for the 2015 Stanley Cup Champion was Chicago Blackhawks.
To be clear, this blog entry was posted after the playoffs were already over. The explanatory text in the R Markdown documents was also written during the playoffs. But the same prediction as presented above can be seen in this GitHub commit (and the same HTML document on RawGit) from April 23rd. This was not before the playoffs started (April 15th), but when the first round was 3-4 games in, depending on the series.
Validation Set
And since the playoffs are in fact already over, it means that the natural validation set is also available. Chicago Blackhawks did end up winning the Cup, but how did I do otherwise? Below are the predictions again, now together with the real outcomes. And since an incorrect prediction in one round leads to wrong pairs on the subsequent rounds, I have added in the series that actually ended up happening. (I made a prediction for all possible games that could happen, but only presented the resulting bracket here.) These added ones are in italics.
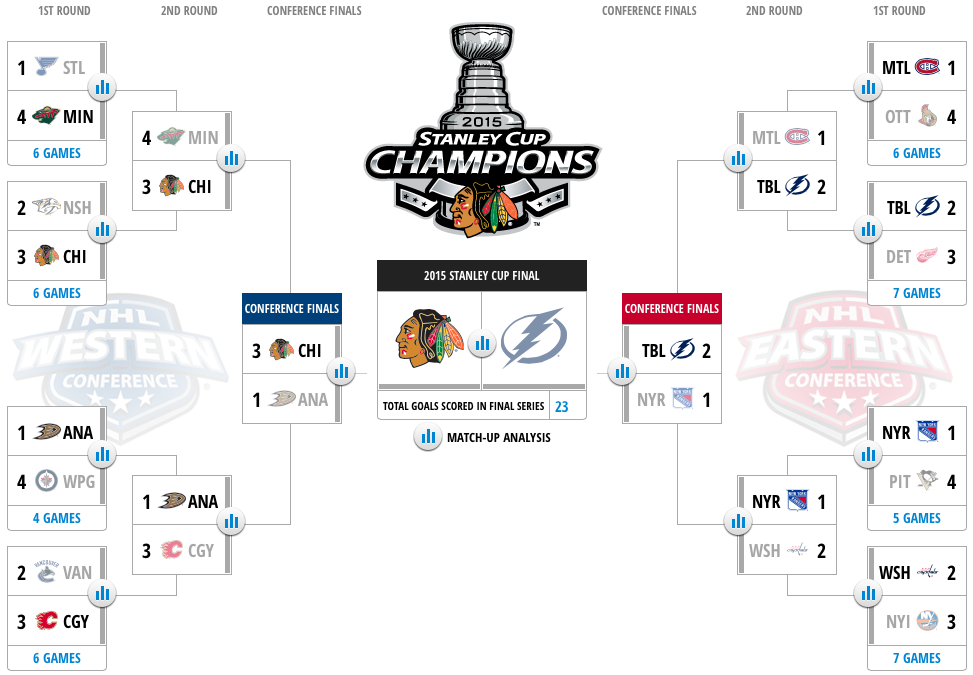
Round 1
- Pittsburg Penguins at New York Rangers – correct
- Ottawa Senators at Montreal Canadians – correct
- Detroit Red Wings at Tampa Bay Lightning – correct
- New York Islanders at Washington Capitals – INCORRECT
- Winnipeg Jets at Anaheim Ducks – correct
- Minnesota Wild at St. Louis Blues – INCORRECT
- Chicago Blackhawks at Nashville Predators – correct
- Calgary Flames at Vancouver Canucks – correct
Round 2
- Washington Capitals at New York Rangers – correct
- Tampa Bay Lightning at Montreal Canadians – INCORRECT
- Calgary Flames at Anaheim Ducks – correct
- Minnesota Wild at Chicago Blackhawks – correct
Round 3 – Conference Finals
- Tampa Bay Lightning at New York Rangers – INCORRECT
- Chicago Blackhawks at Anaheim Ducks – correct
Round 4 – Stanley Cup Finals
- Chicago Blackhawks at Tampa Bay Lightning – correct
Overall, my accuracy was 11 out of 15, which is 73%.
An obvious follow-up from here could be to look at each of the five different models (generalized linear model, linear discriminant analysis, neural network, random forest, and support vector machine with a linear kernel) and compare their accuracies against each other.