I have been running the Moves app on my phone for almost two years. I guess its main idea is to be an activity tracker; it’ll tell you how much you’ve walked, ran, or ridden a bike, without you having to remember to turn it on before starting an “activity”. But for me the main point isn’t as much the activity part as it is the tracking part. Without me having to do anything, the app silently collects data about my movements in the background. I can then download the accumulated data and play around with it in R.
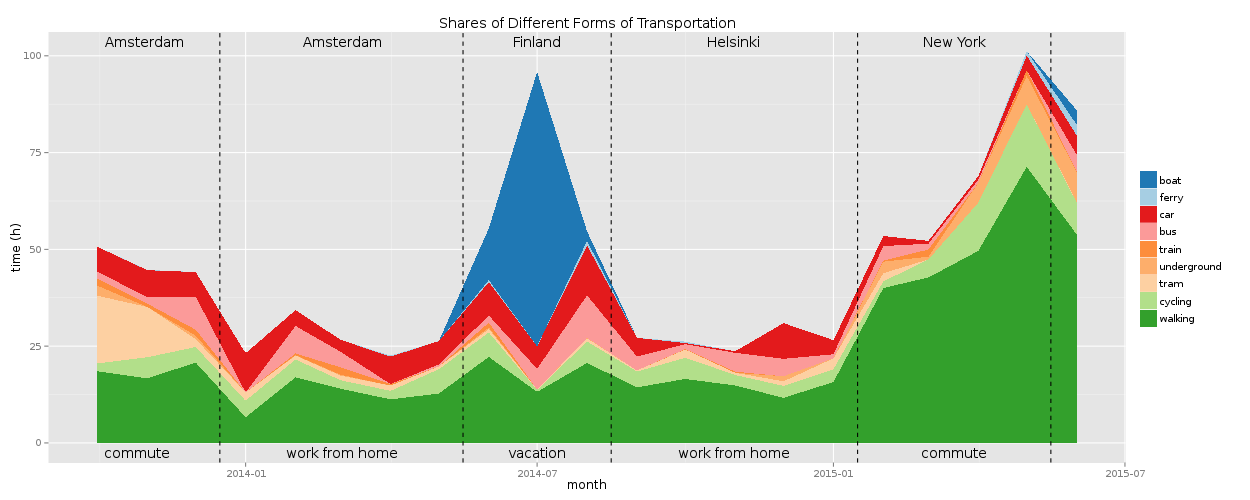
When I was at the Recurse Center, I needed a little project to work on learning ggplot2 and shiny, and chose to do a remake of this old blog post on the shares of different modes of transportation I use. The end result is packaged into a shiny app, and shows for example that in New York I walked a lot more than I used to while living in Amsterdam or Helsinki, and that last summer I spent a lot of time on boats. A more subtle difference is that in Amsterdam I seemed to use trams only for commuting to work.
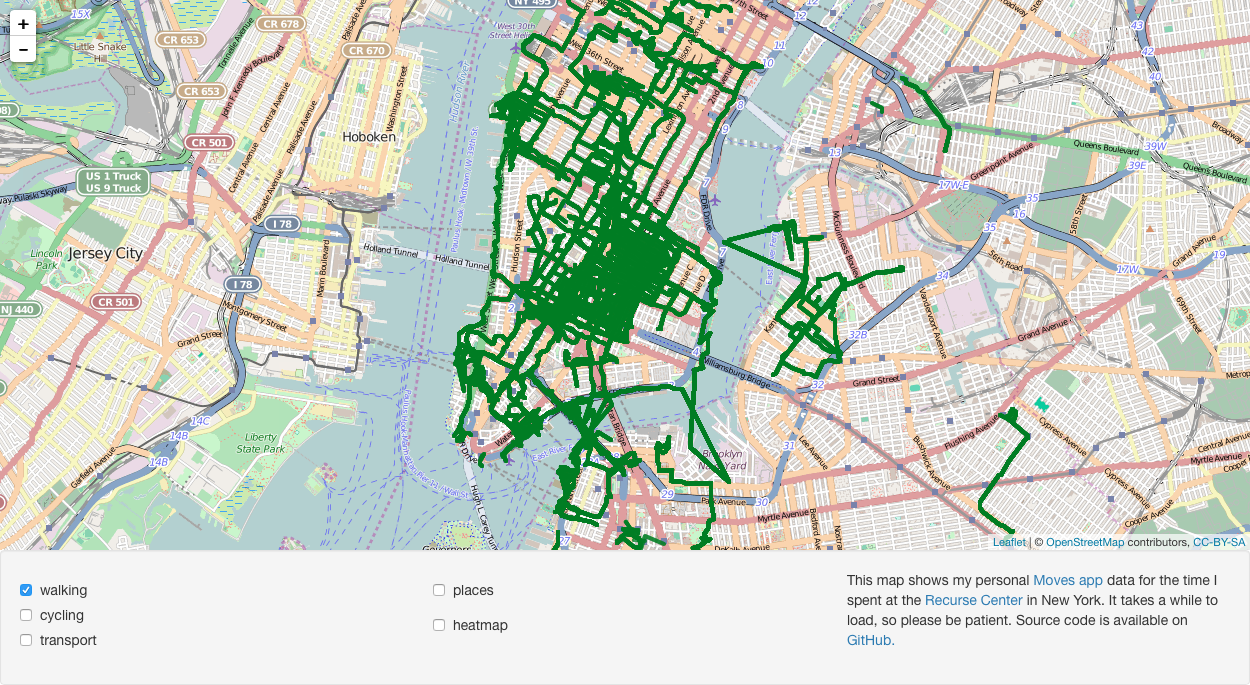
I also wanted to try out some mapping with leaflet, and made another app that shows all my movement while I was in New York. If all checkboxes are turned on, four months of data seems to be a bit much to handle performance-wise, and the app becomes slow and sometimes crashes (turns gray and stops responding). Anyways, it was a fun experiment to do.
The source code is available on GitHub.

